
The Swing Territory
Presidential straw polls in Guam reveal the deep, complex political history of this diverse island

Guam, like other territories of the United States, is largely ignored not only by the American government and populace but also by most political observers. The island, the largest of the Marianas, the rest of which are also administered by the US as part of the Northern Mariana Islands, has a rich political history dating back to 1950, when rising tensions and demands for self-government led the federal government to pass the Guam Organic Act, which organized Guam as an unincorporated territory, providing for American citizenship for Guamanians and a territorial government consisting of an elected judiciary and unicameral legislature, and a governor appointed by the President (which would later become elected as well, beginning in 1968).
With time has come growing calls for increased political rights, autonomy, and self-determination. In some cases, this has led to change — in 1950, the aforementioned Guam Organic Act; in 1968, the introduction of gubernatorial elections; and in 1972, the introduction of a non-voting delegate to the House of Representatives, which the US’s other territories as well as the District of Columbia also have — but these changes have largely been incremental and have fallen short of Guamanians’ complete demands.

In 1980, the Guam Legislature established a Commission on Self-Determination, which two years later organized a referendum on the territory’s status. Though turnout was low at only 38%, the referendum’s results nevertheless shed light on voters’ political wishes for the island’s future. The leading option, with 49% of the vote, was for the territory to be reorganized as a commonwealth, a status currently held by Puerto Rico and the Northern Mariana Islands (and formerly by the Philippines until its independence), which allows for a greater level of self-government and autonomy than non-commonwealth territorial status.
26% voted for statehood, 10% for the status quo, 5% for territorial incorporation (a permanent status in which the Constitution would apply in full to the territory; currently, Guam and all other inhabited American territories are unincorporated, meaning the Constitution only partially applies), 4% for a compact of free association (a status currently held by the Marshall Islands, Micronesia, and Palau, wherein the country is sovereign but has defense and certain funding grants provided for by the United States), and 4% for full independence. As no option received a majority, a runoff between the top two was held later that year. With a significantly elevated 81% turnout, helped by the runoff’s coinciding with territorial primary elections, commonwealth status won overwhelmingly, with 73% of the vote to statehood’s 27%.
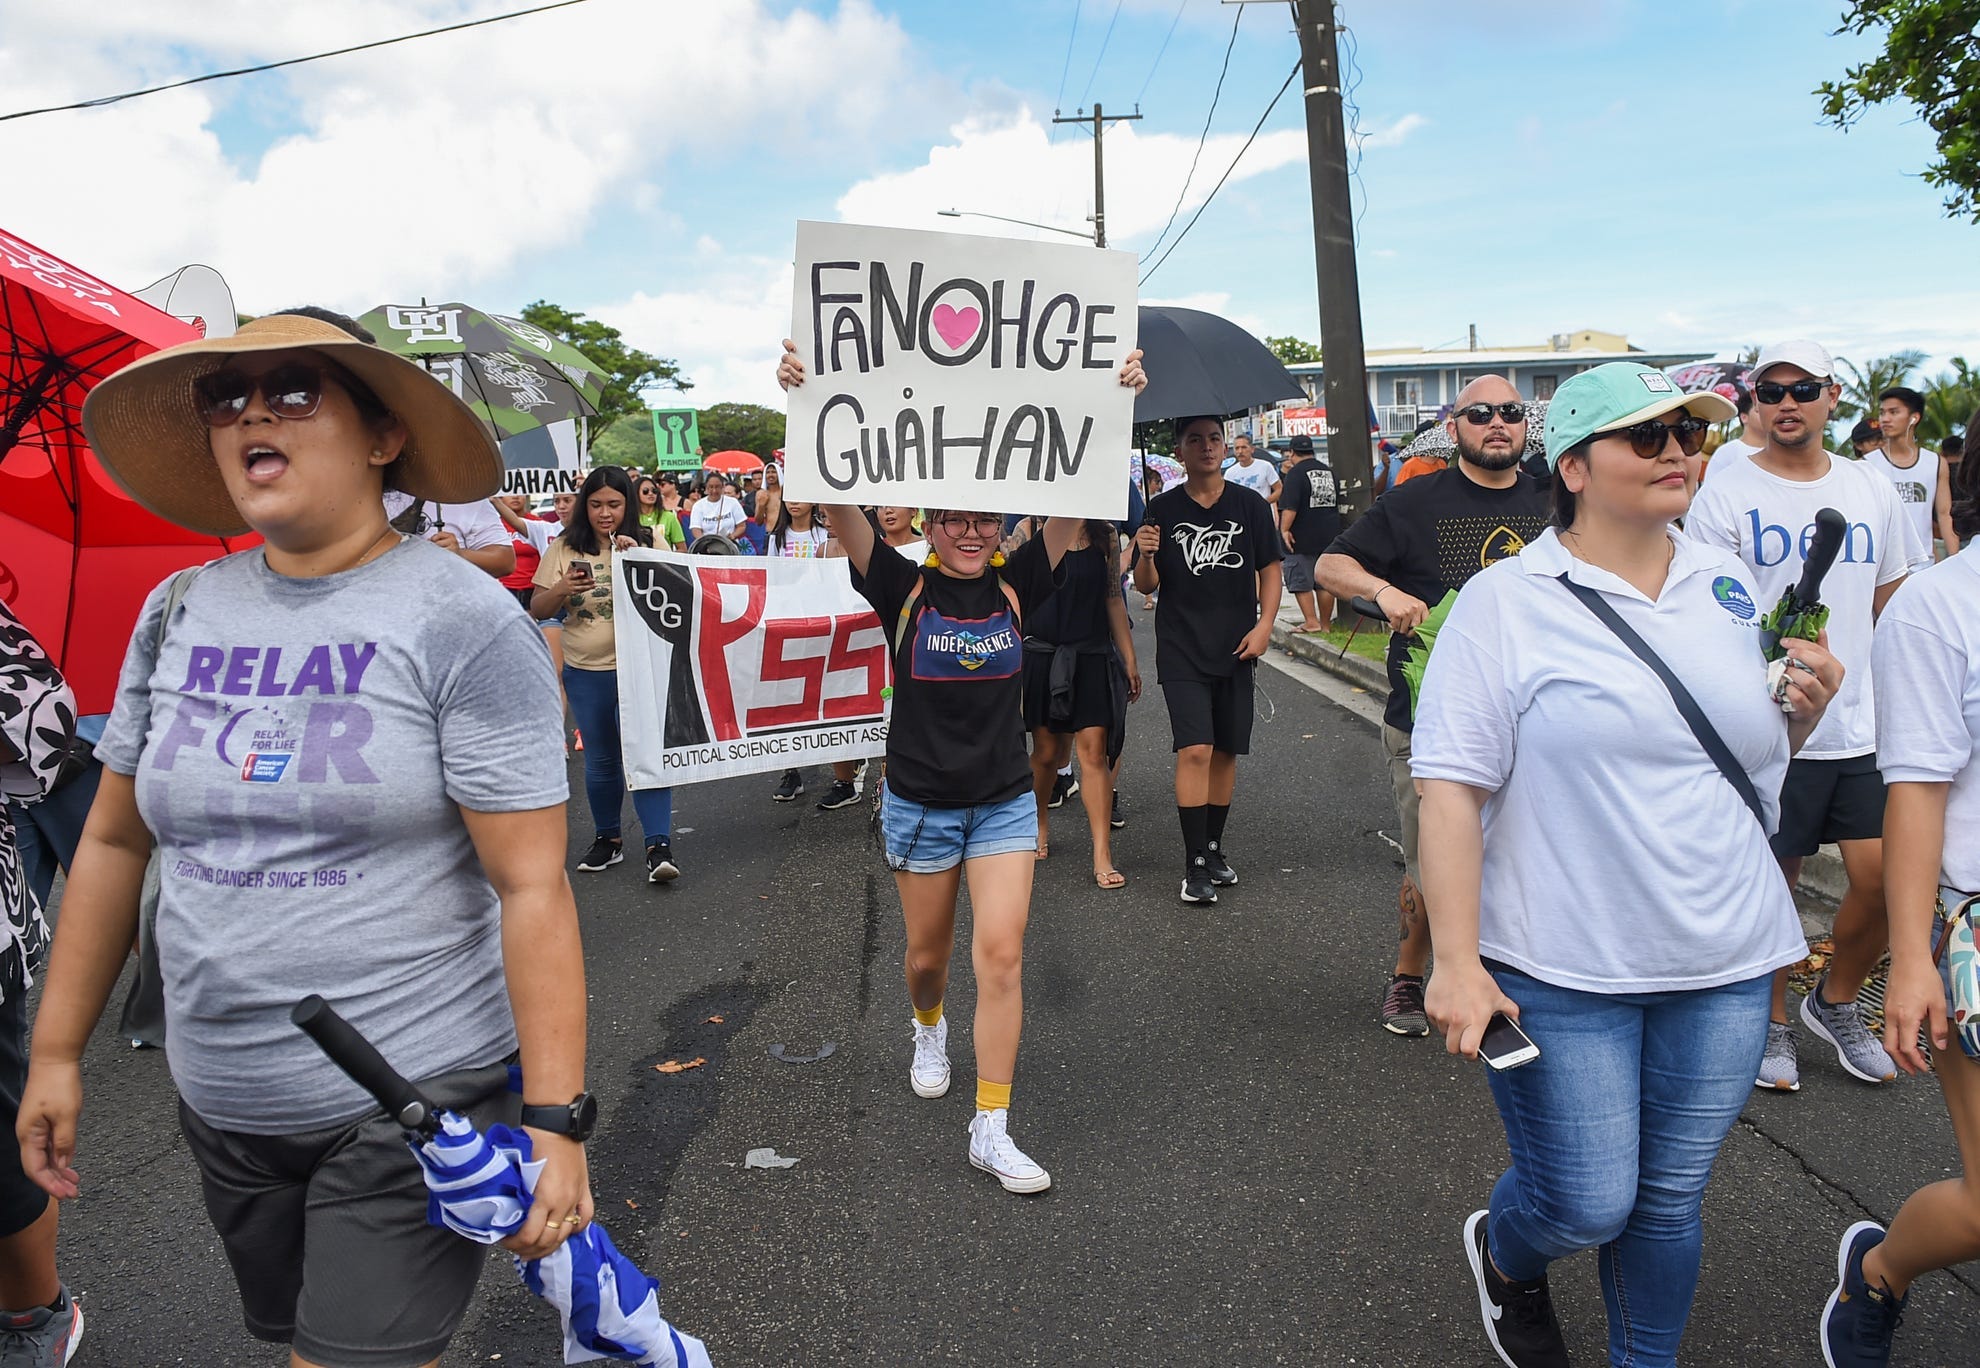
Despite this clear majority and the wishes of 90% of the initial referendum’s voters depart from the status quo, no changes have been made to Guam’s territorial status since its original organization 70 years ago. Nevertheless, Guamanians’ efforts have persisted. In 1997, the Legislature established a Commission on Decolonization to explore political status options, with the intent of ultimately achieving successful self-determination and anti-colonial liberation through statehood, free association, or independence.
After a period of dormancy, the Commission began developing a public education campaign throughout the island on Guam’s current relationship with the federal government and the various decolonization options available, and last year, Guam joined the Unrepresented Nations and Peoples Organization, an association of dozens of entities around the world seeking self-determination, including the District of Columbia. Though progress has moved slowly, the United Nations Special Committee on Decolonization has backed these moves, and Guamanians’ ambitions for autonomy and self-determination remain resolute.
One of the more notable and permanent developments in Guam’s self-determination campaign has been the regular practice since 1980 of holding “straw polls” for US presidential elections, with the intent of both illuminating Guam’s lack of federal voting rights and demonstrating Guamanians’ national preferences.
Despite what many would assume about an overwhelmingly non-white territory, and in contrast with the more consistent Democratic leanings of territories such as Puerto Rico and the US Virgin Islands, the results of Guam’s presidential preference polls have been more split, establishing Guam as what one might dub a swing territory. Indeed, this matches the competitive nature of its territorial politics, which have seen long stretches both of Democratic control and of Republican control.
Before diving into Guam’s election results, we’ll take a look at the island’s ethnic and racial demographics and the geographic distribution of those groups. The plurality of Guamanians — 37%, to be exact — are CHamoru (also known as Chamorro), the indigenous peoples of the Mariana Islands. 7% are Chuukese, those native to the Chuuk state of the Federated States of Micronesia, and another 5% belong to other Pacific Islander groups. The second largest group is Filipinos, who comprise 26% of Guam’s population, and whose presence there traces back to the islands’ shared history of Spanish colonization but is mostly a result of an influx of immigrant workers in the aftermath of the devastation the island suffered during World War II. Other Asians make up an additional 6% of the population. Guam is also 7% white, 1% Black, and 1% Hispanic, and the remaining 9% or so of the population is mixed.
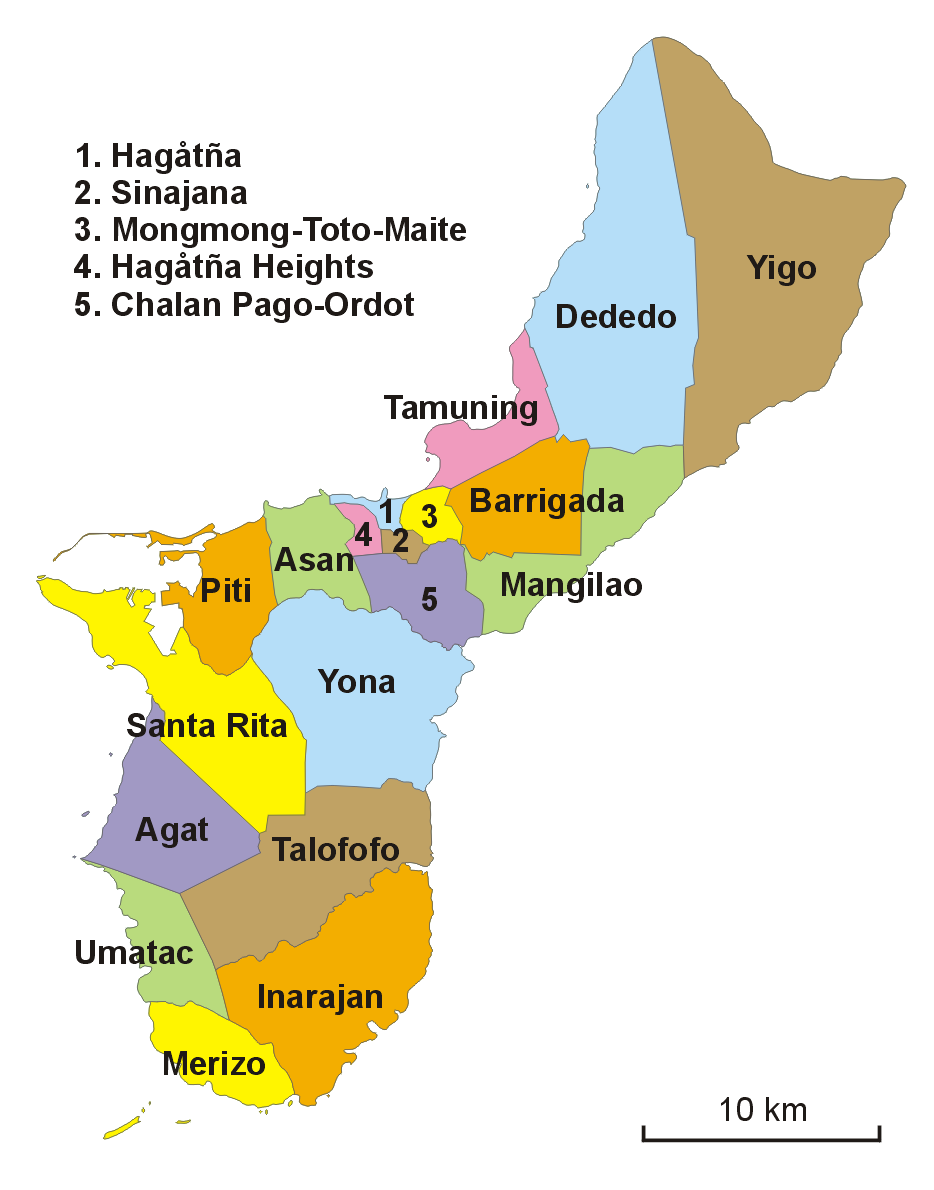
As the chart above indicates, ethnic groups aren’t distributed evenly across the island. While most villages are overwhelmingly CHamoru, Filipinos make up a plurality in Dededo (the most populated village), Tamuning, and Yigo. Chuukese are most predominant in Hagåtña, whites are a near-plurality in Santa Rita, and Tamuning has the greatest concentration of Japanese, Koreans, and Chinese. For reference, here’s a map of the island’s 19 villages, with their names labeled.
Below are maps of the CHamoru and Filipino population shares, respectively, by village.
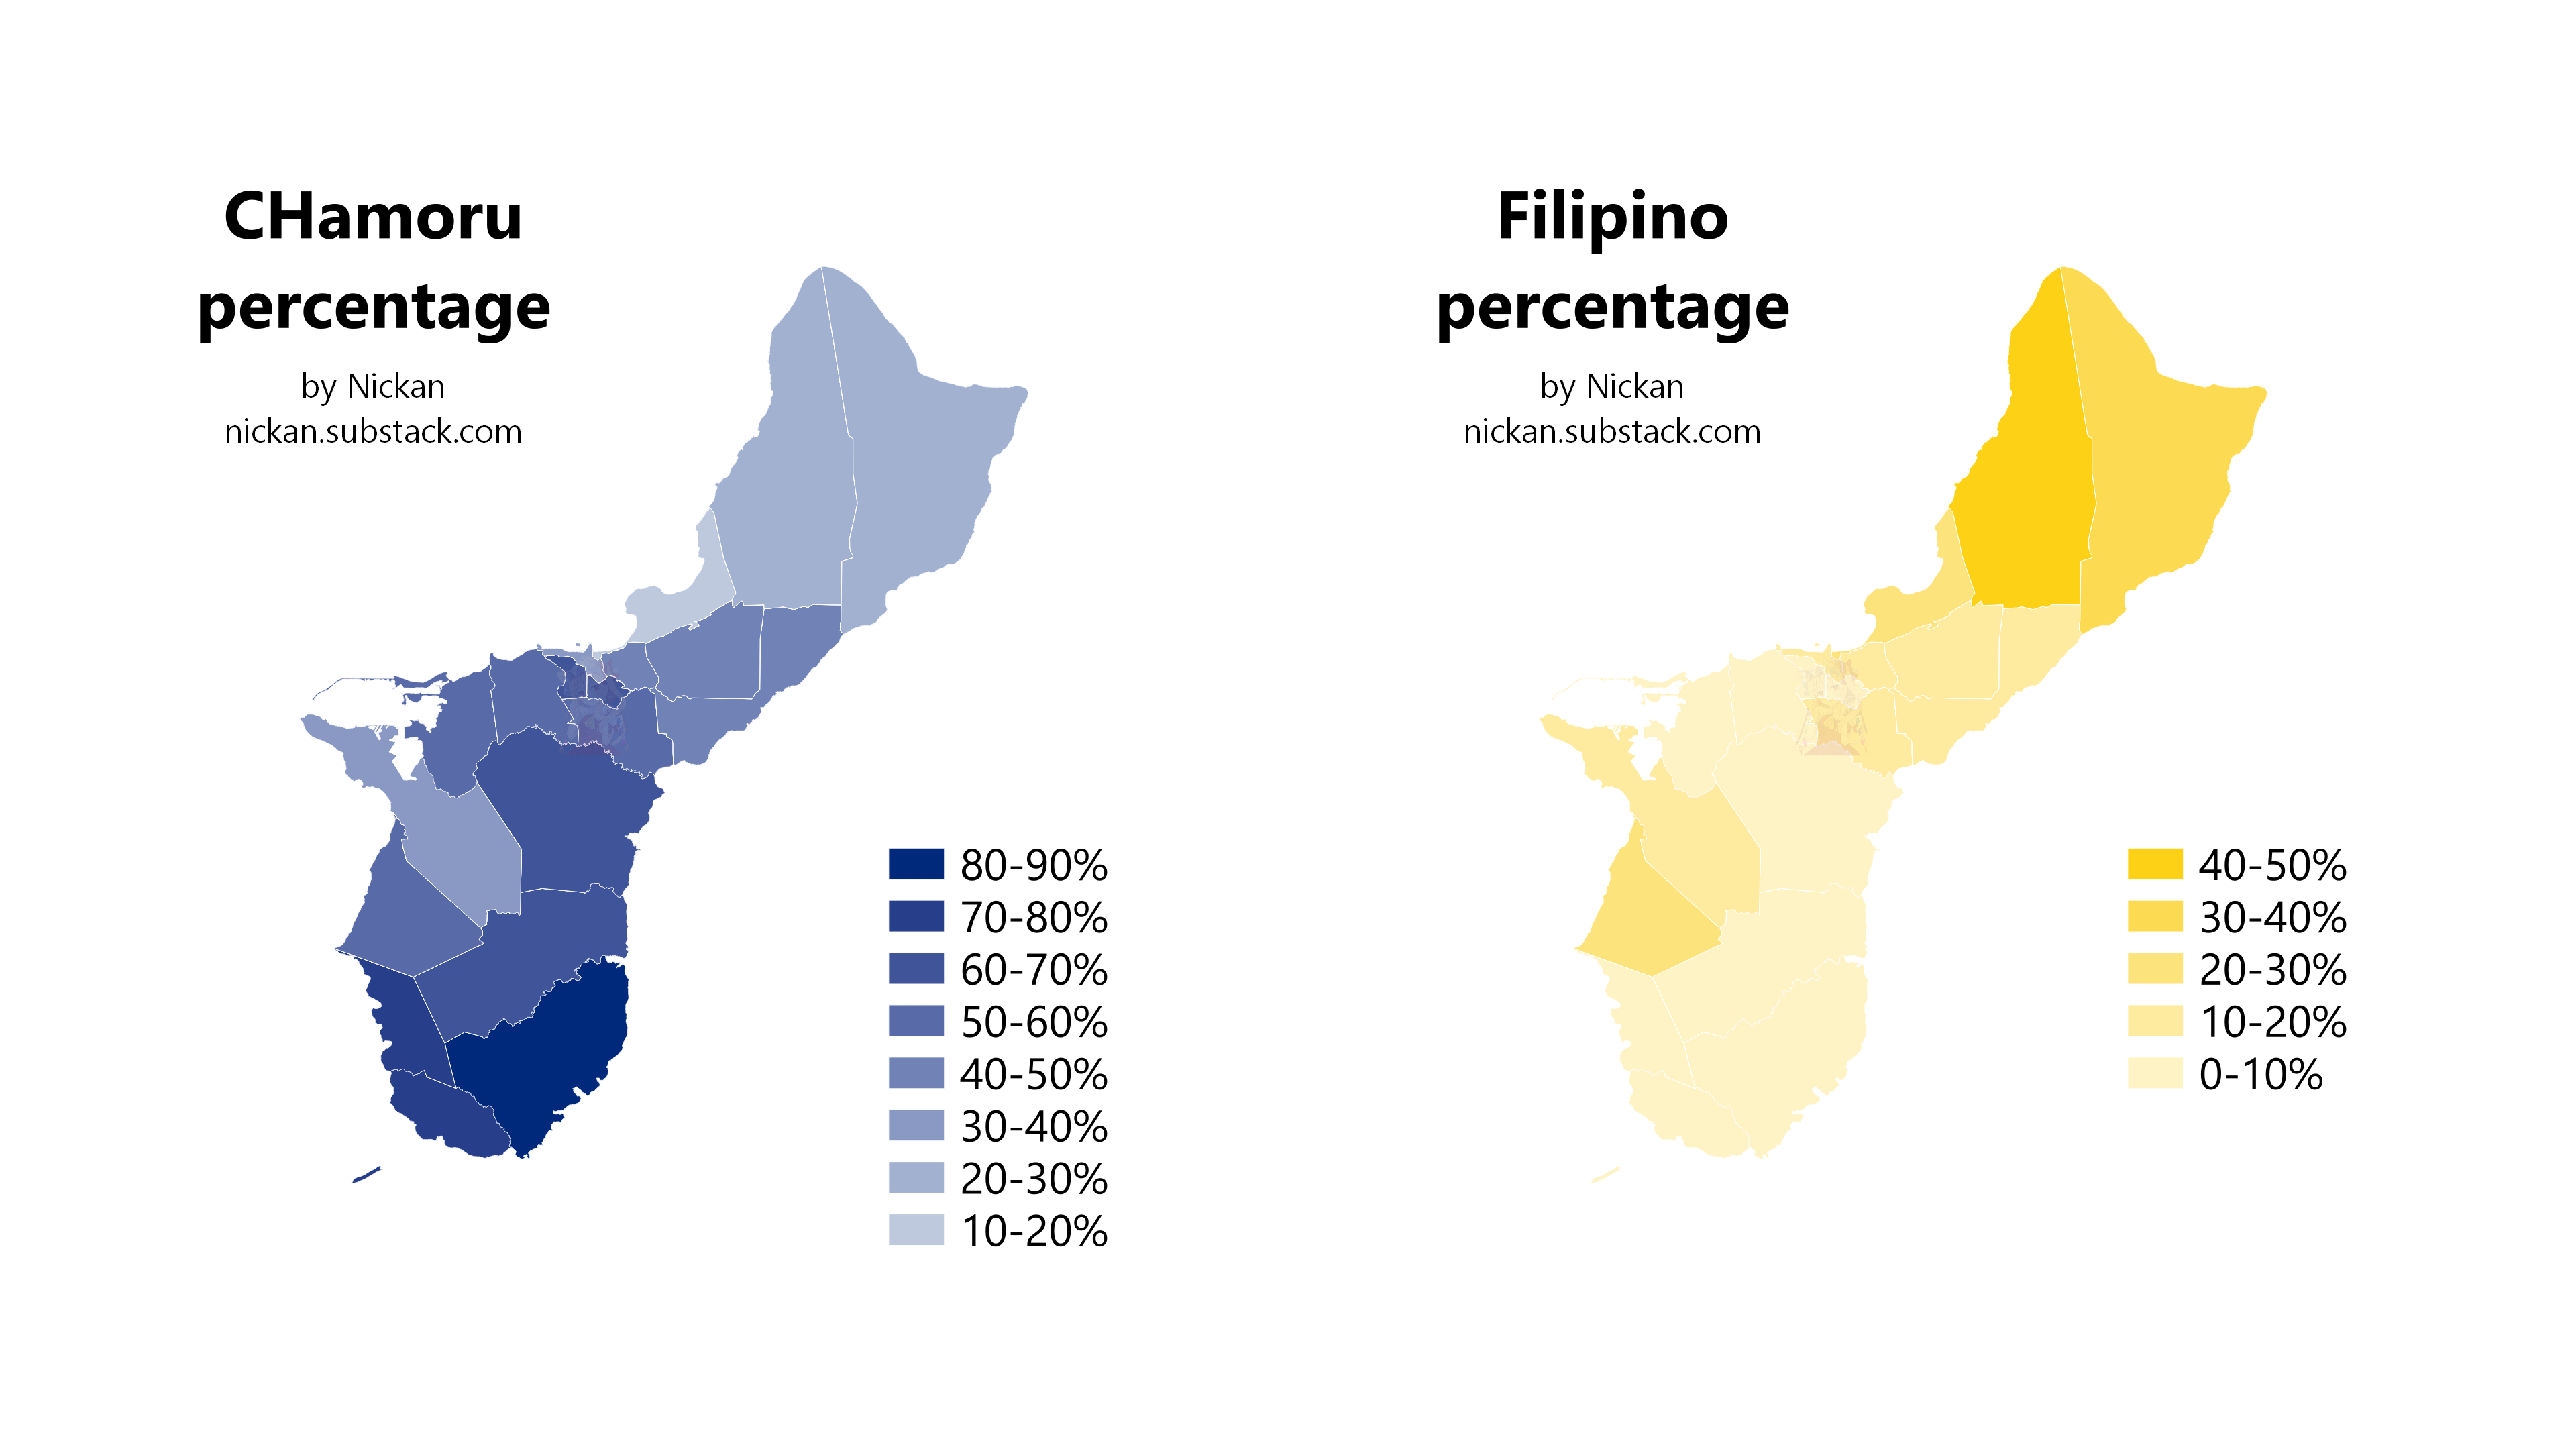
CHamorus dominate the southern half of the island, while Filipinos are more prevalent in the north. Hagåtña, Santa Rita, and Tamuning stand out as being lightly shaded on both maps; the aforementioned presences of other groups keeps CHamorus and Filipinos uniquely at a combined minority in those three villages. Keep these maps in mind when looking at results later in the article, as they help paint part — but not all — of the picture. Anyways, onward to the presidential votes.
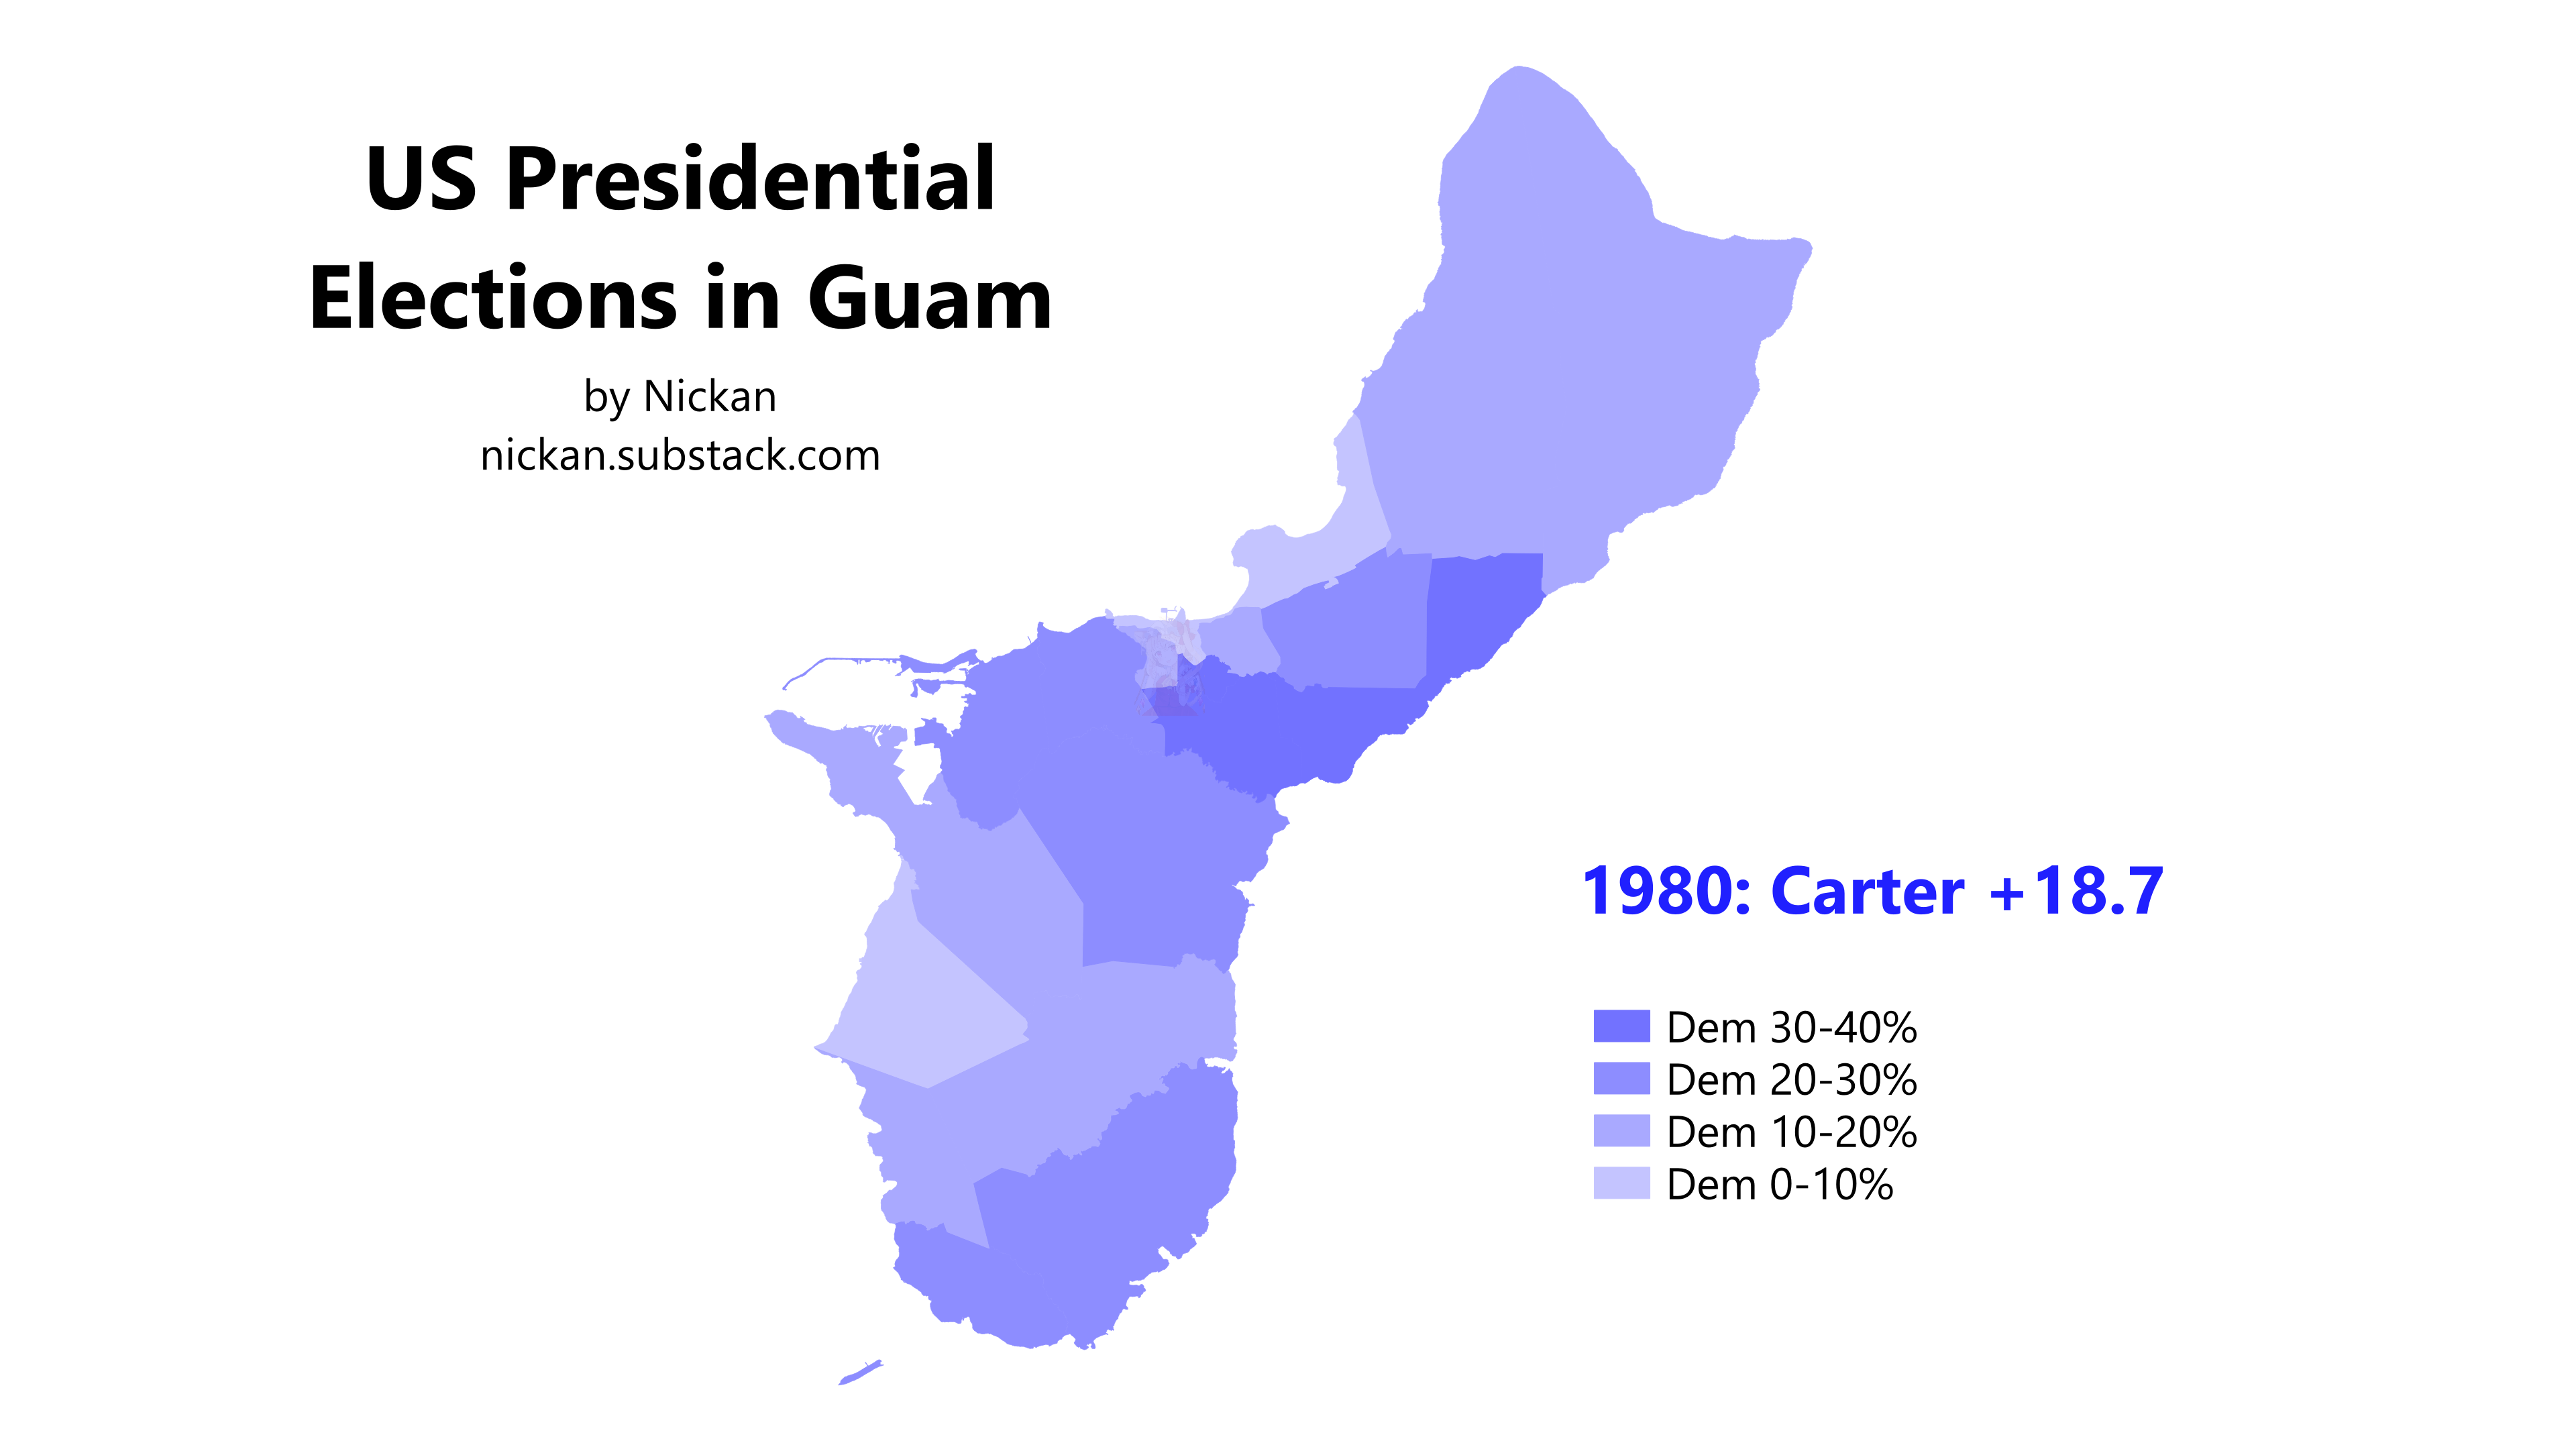
From the start, voter engagement in Guam’s presidential straw polls has been incredibly high. Over 25 thousand voters cast ballots in the 1980 election, representing over three-quarters of registered voters, dwarfing the 53% turnout rate across the rest of the United States. Unlike the rest of the country, Guamanians voted decisively for Jimmy Carter, giving him 57% of the vote to Ronald Reagan’s 38%, while independent John Anderson won 4% and Libertarian Ed Clark came in at just under 1%.
Carter won all 19 of Guam’s villages, with his victories ranging from 4 pts to 36 pts. His weakest performances were in the area in and surrounding the village of Hagåtña, then known officially as Agana, the territorial capital, whose outskirts consist of Mongmong-Toto-Maite, Sinajana, and Agana Heights.
Interestingly, the two villages in particular with the smallest Carter victories were Hagåtña and Tamuning, also the two villages with the largest percentage of residents who are neither CHamoru nor Filipino. Though the village-level demographics at the time are unclear, if they were similar, it’s possible that more recent immigrants — in the decades prior to this period of time, Guam’s population had been virtually all CHamoru, Filipino, or white — were more likely to vote Republican.
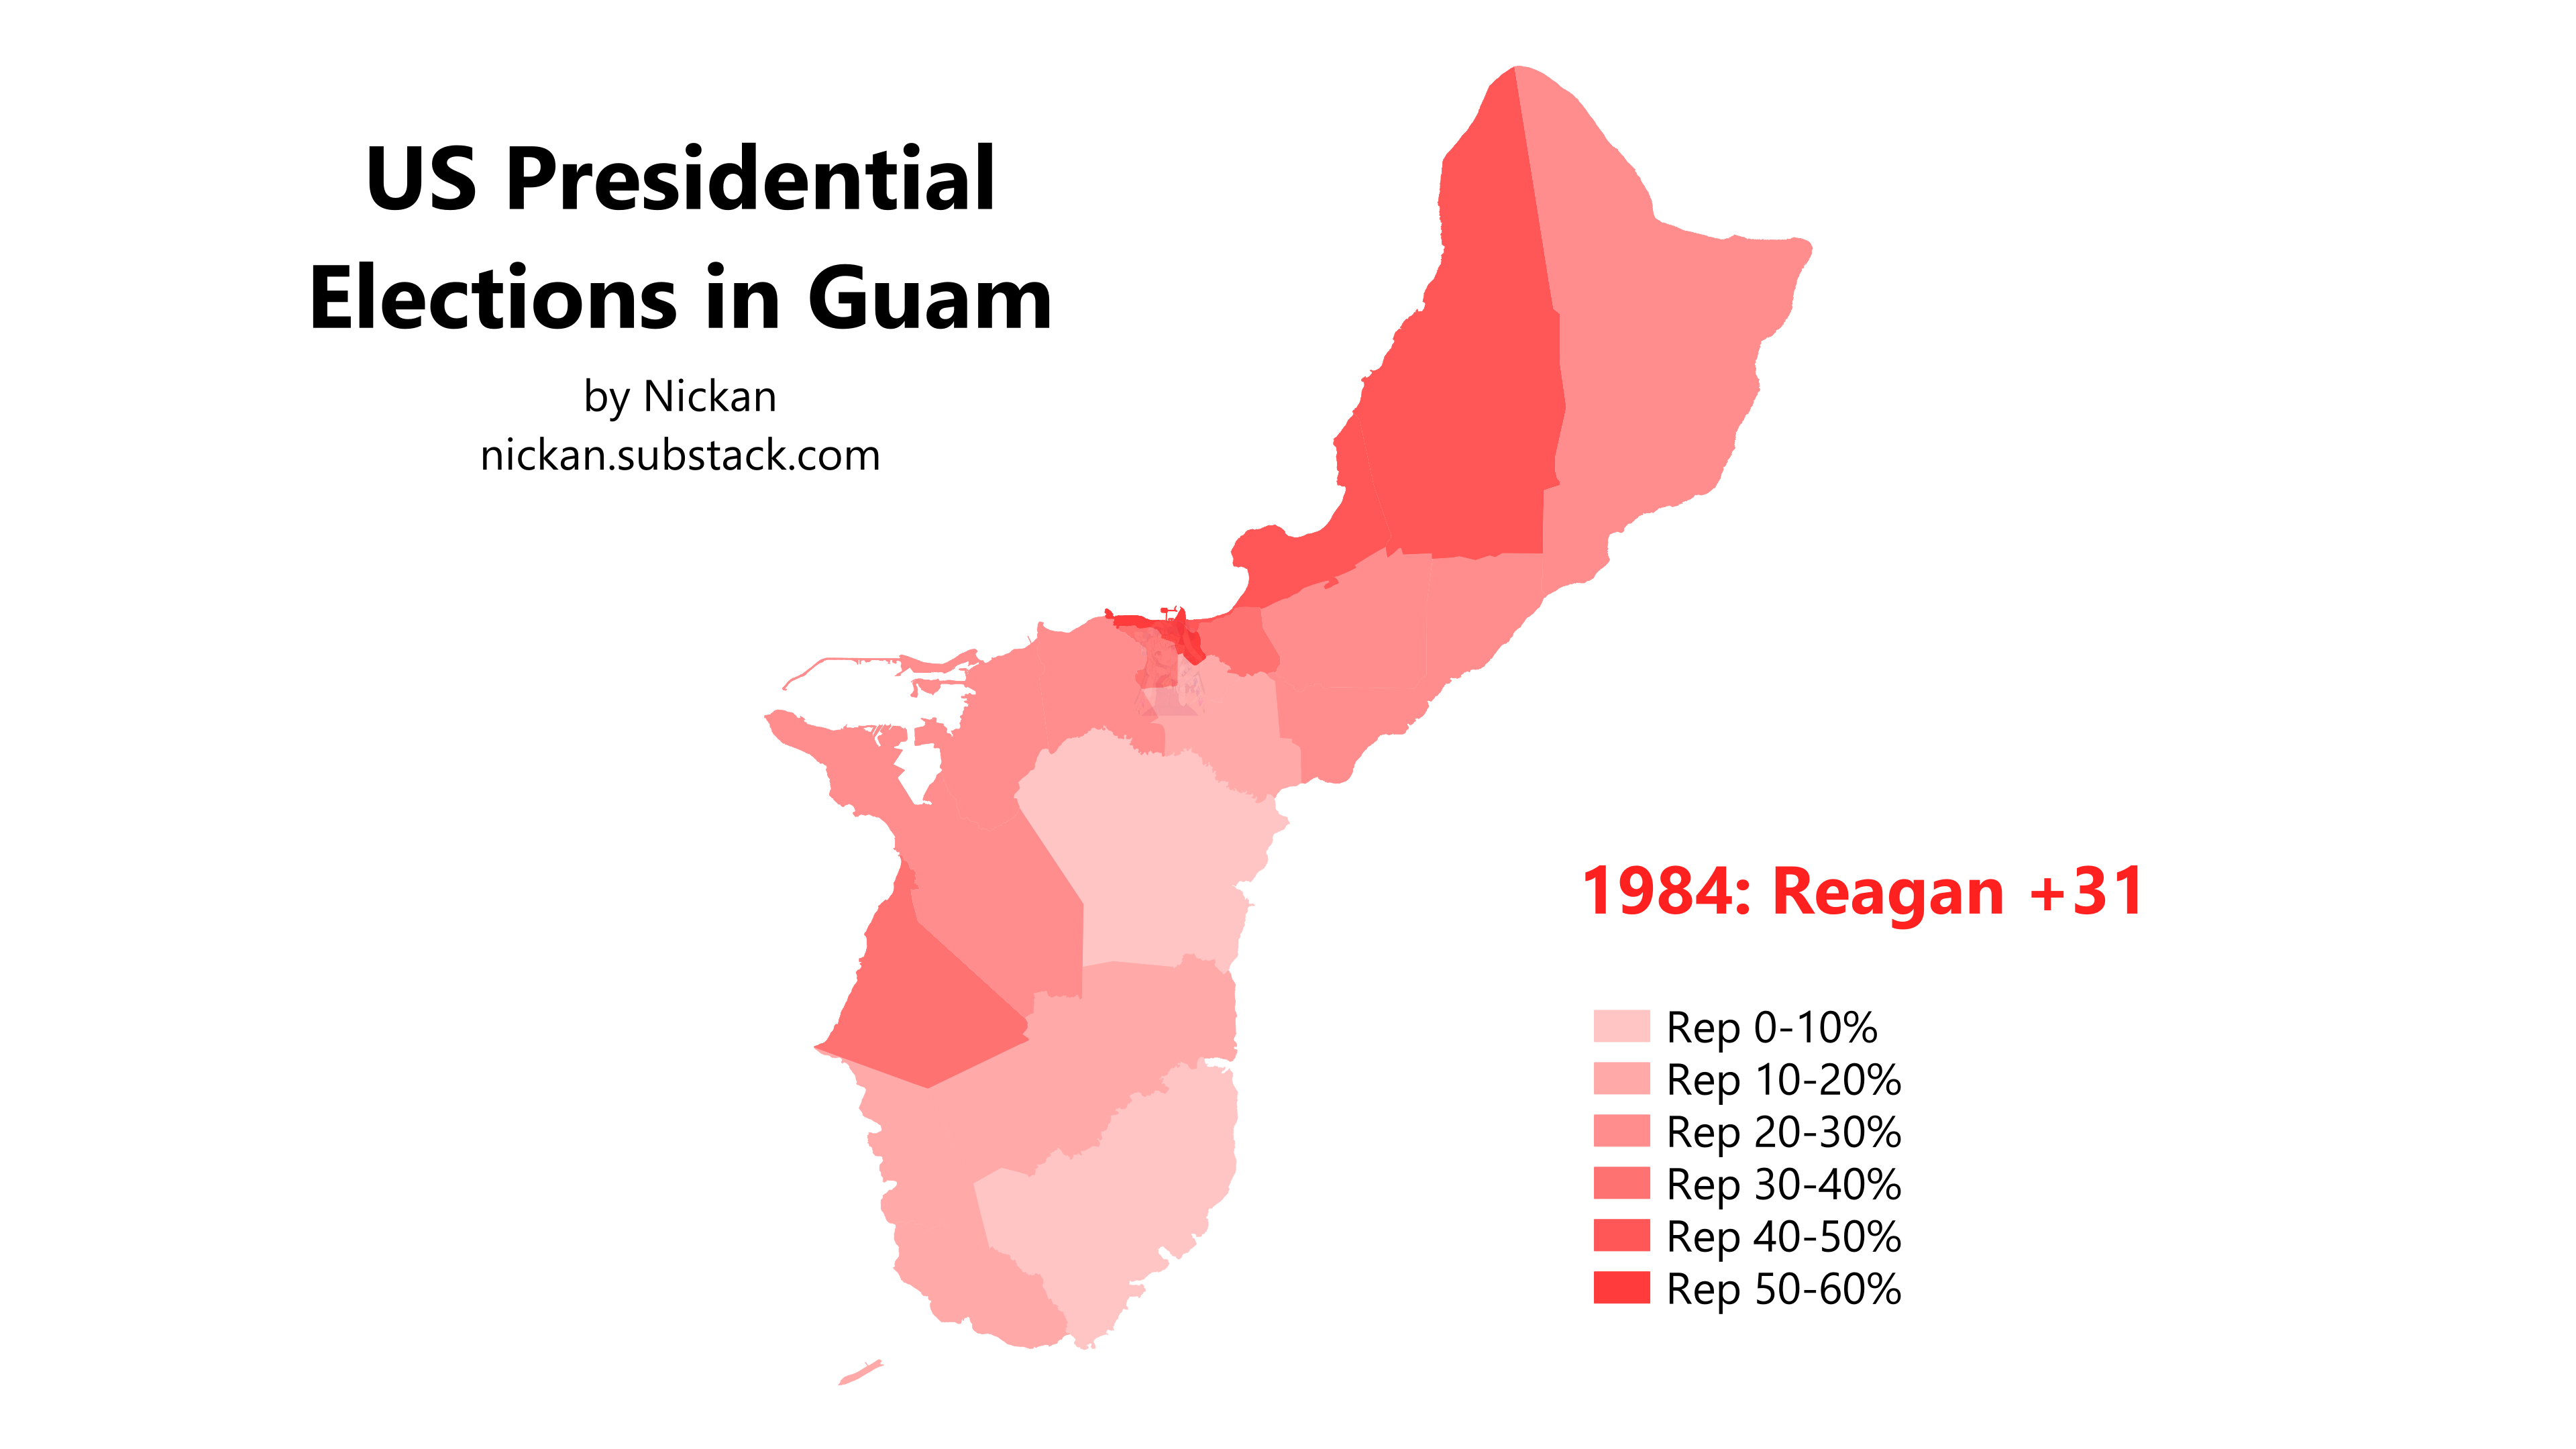
The 1984 election was a nationwide landslide, with Reagan winning all but one state. Similarly, he also swept Guam, winning by an even larger margin than his nationwide total, with the island experiencing a nearly 50-pt rightward swing. Reagan won every village, but was weakest in the southern portion, with his smallest victory — 3 pts — coming in Inalåhan. This would begin a six-election streak of Inalåhan, the most heavily CHamoru village, being the bluest on the island. It would also begin an eight-election streak of Guam voting the same way as the US as a whole.
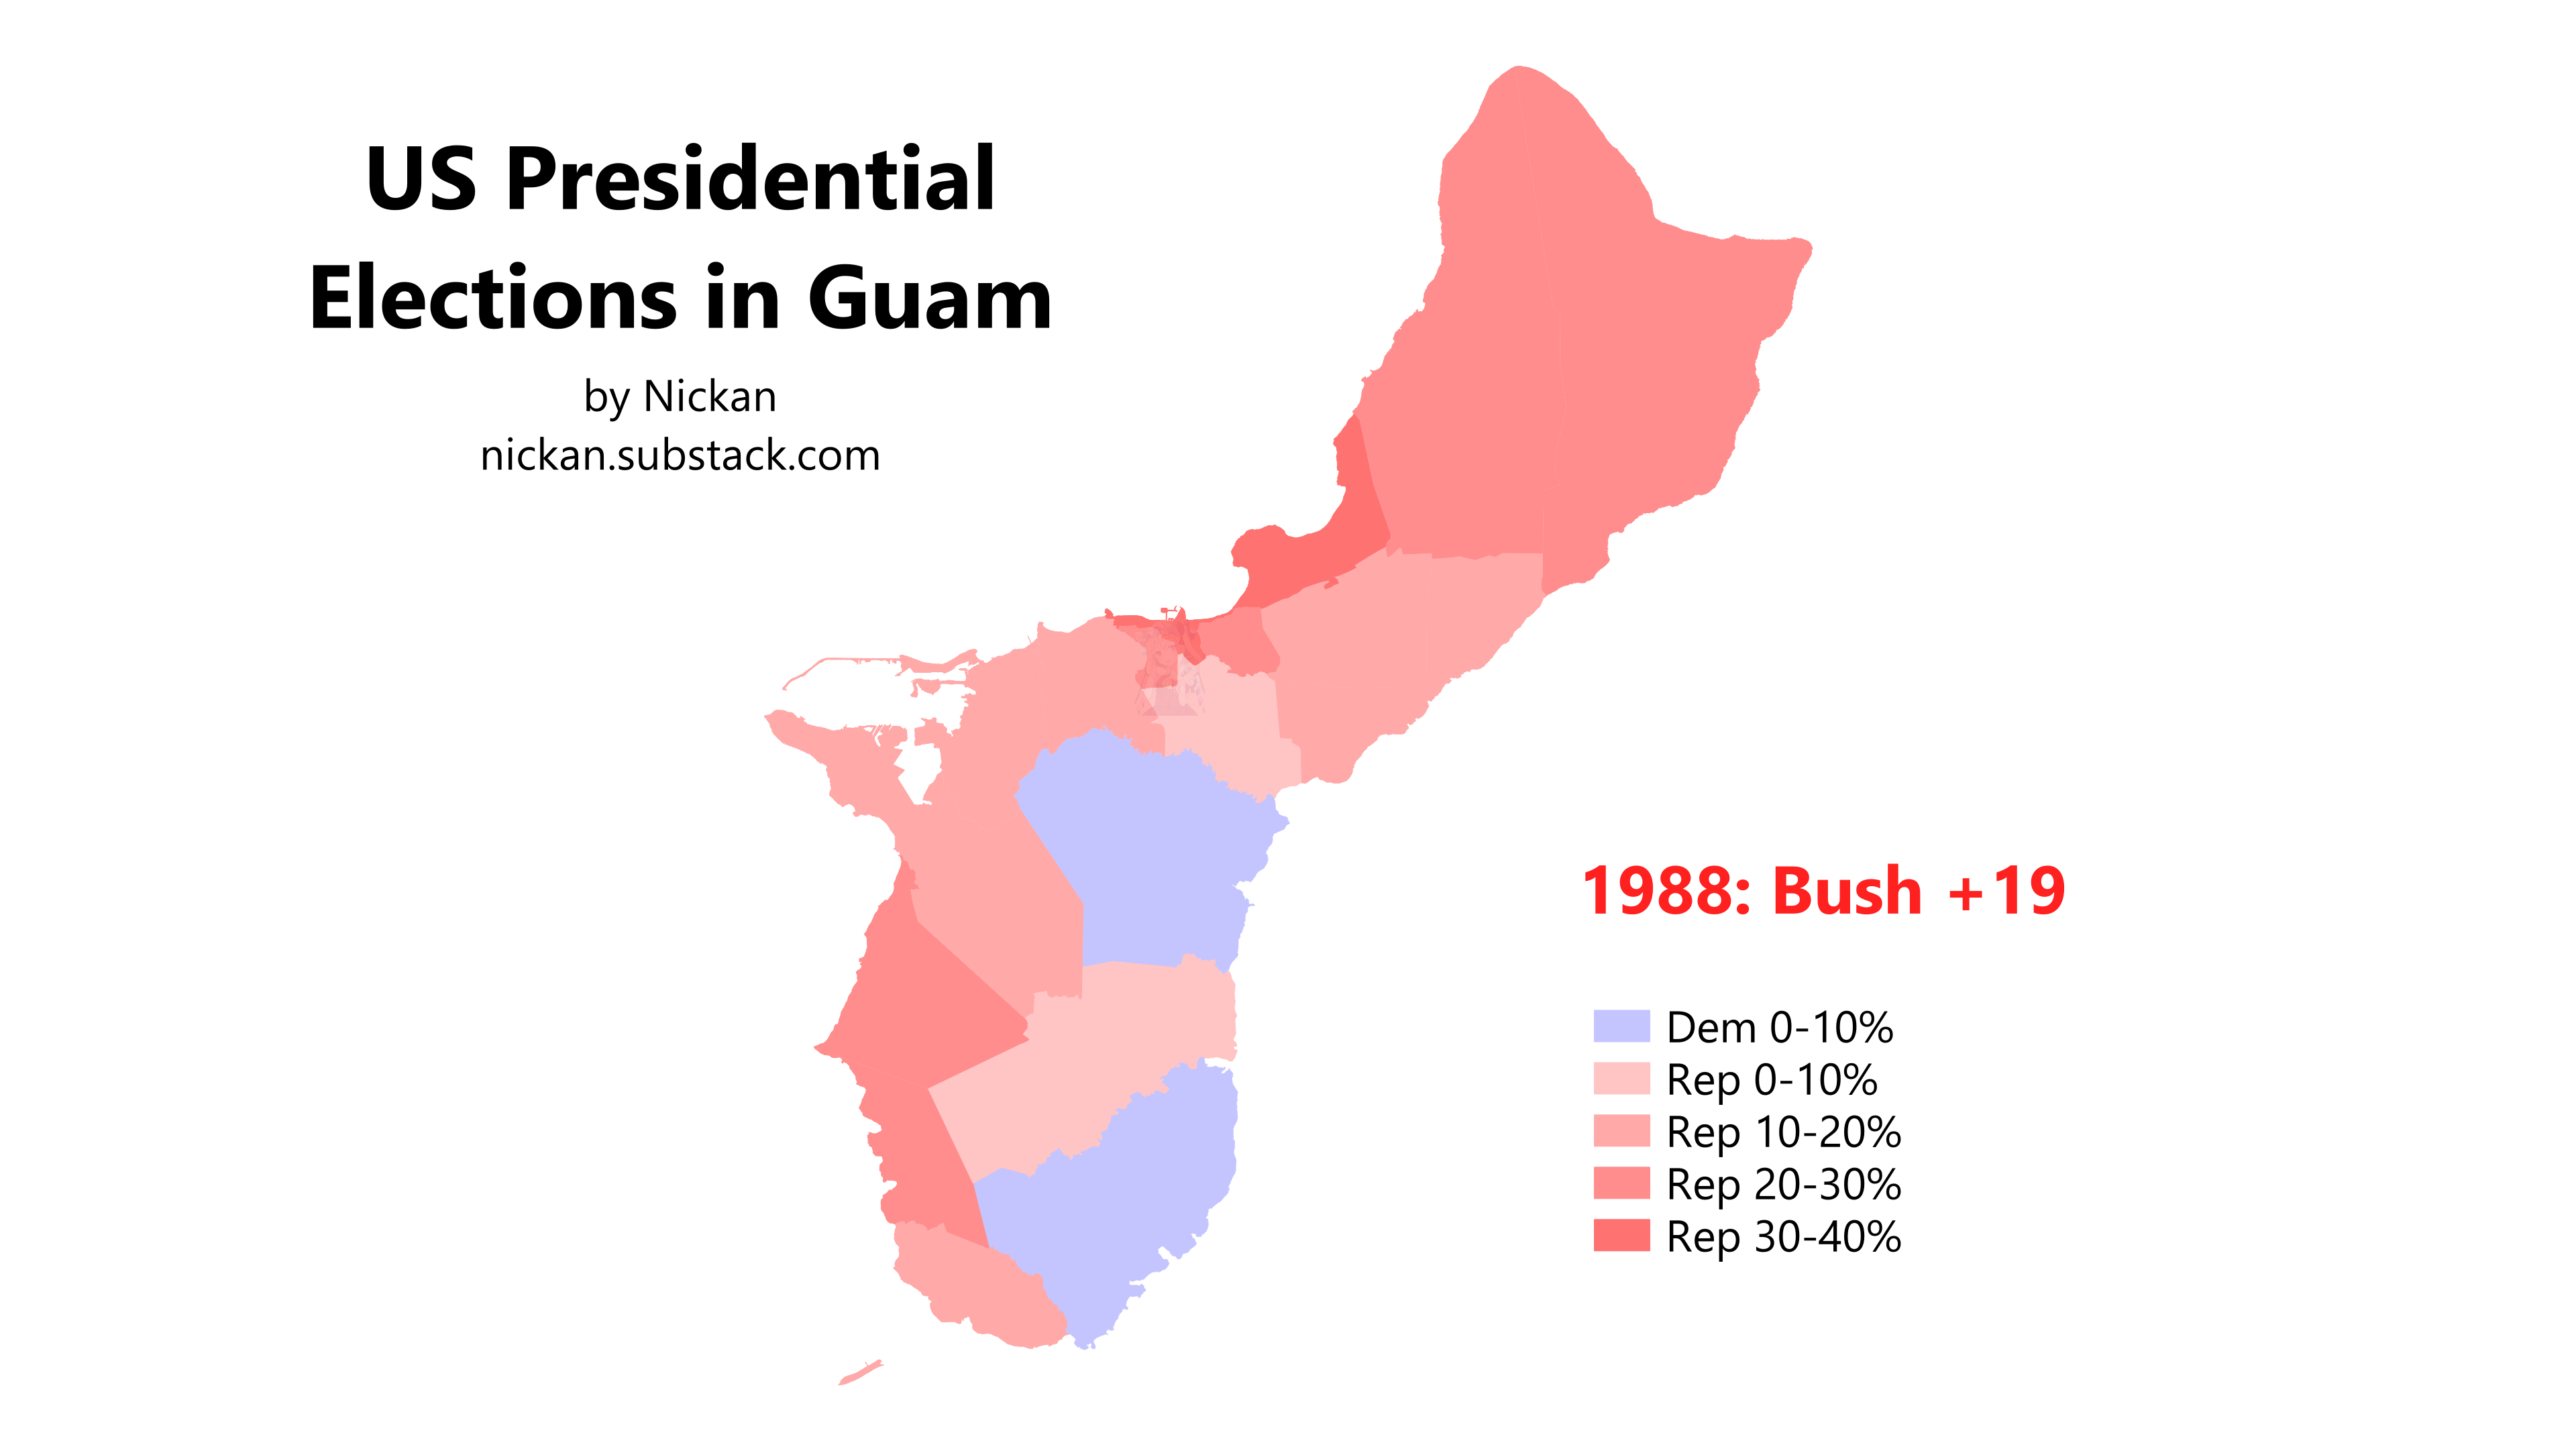
As Republicans held the 1988 election by a narrower margin, so went the Guamanian result. This was, impressively, one of only three elections where not all villages voted for the same candidate. Inalåhan and Yona flipped to Dukakis. Interestingly, Merizo and Umatac, two overwhelmingly CHamoru villages that border Inalåhan, actually swung right (Merizo by less than 1 pt but Umatac by 9; Umatac, it's worth noting, actually had the smallest rightward swing in 1984), while all other villages swung left.
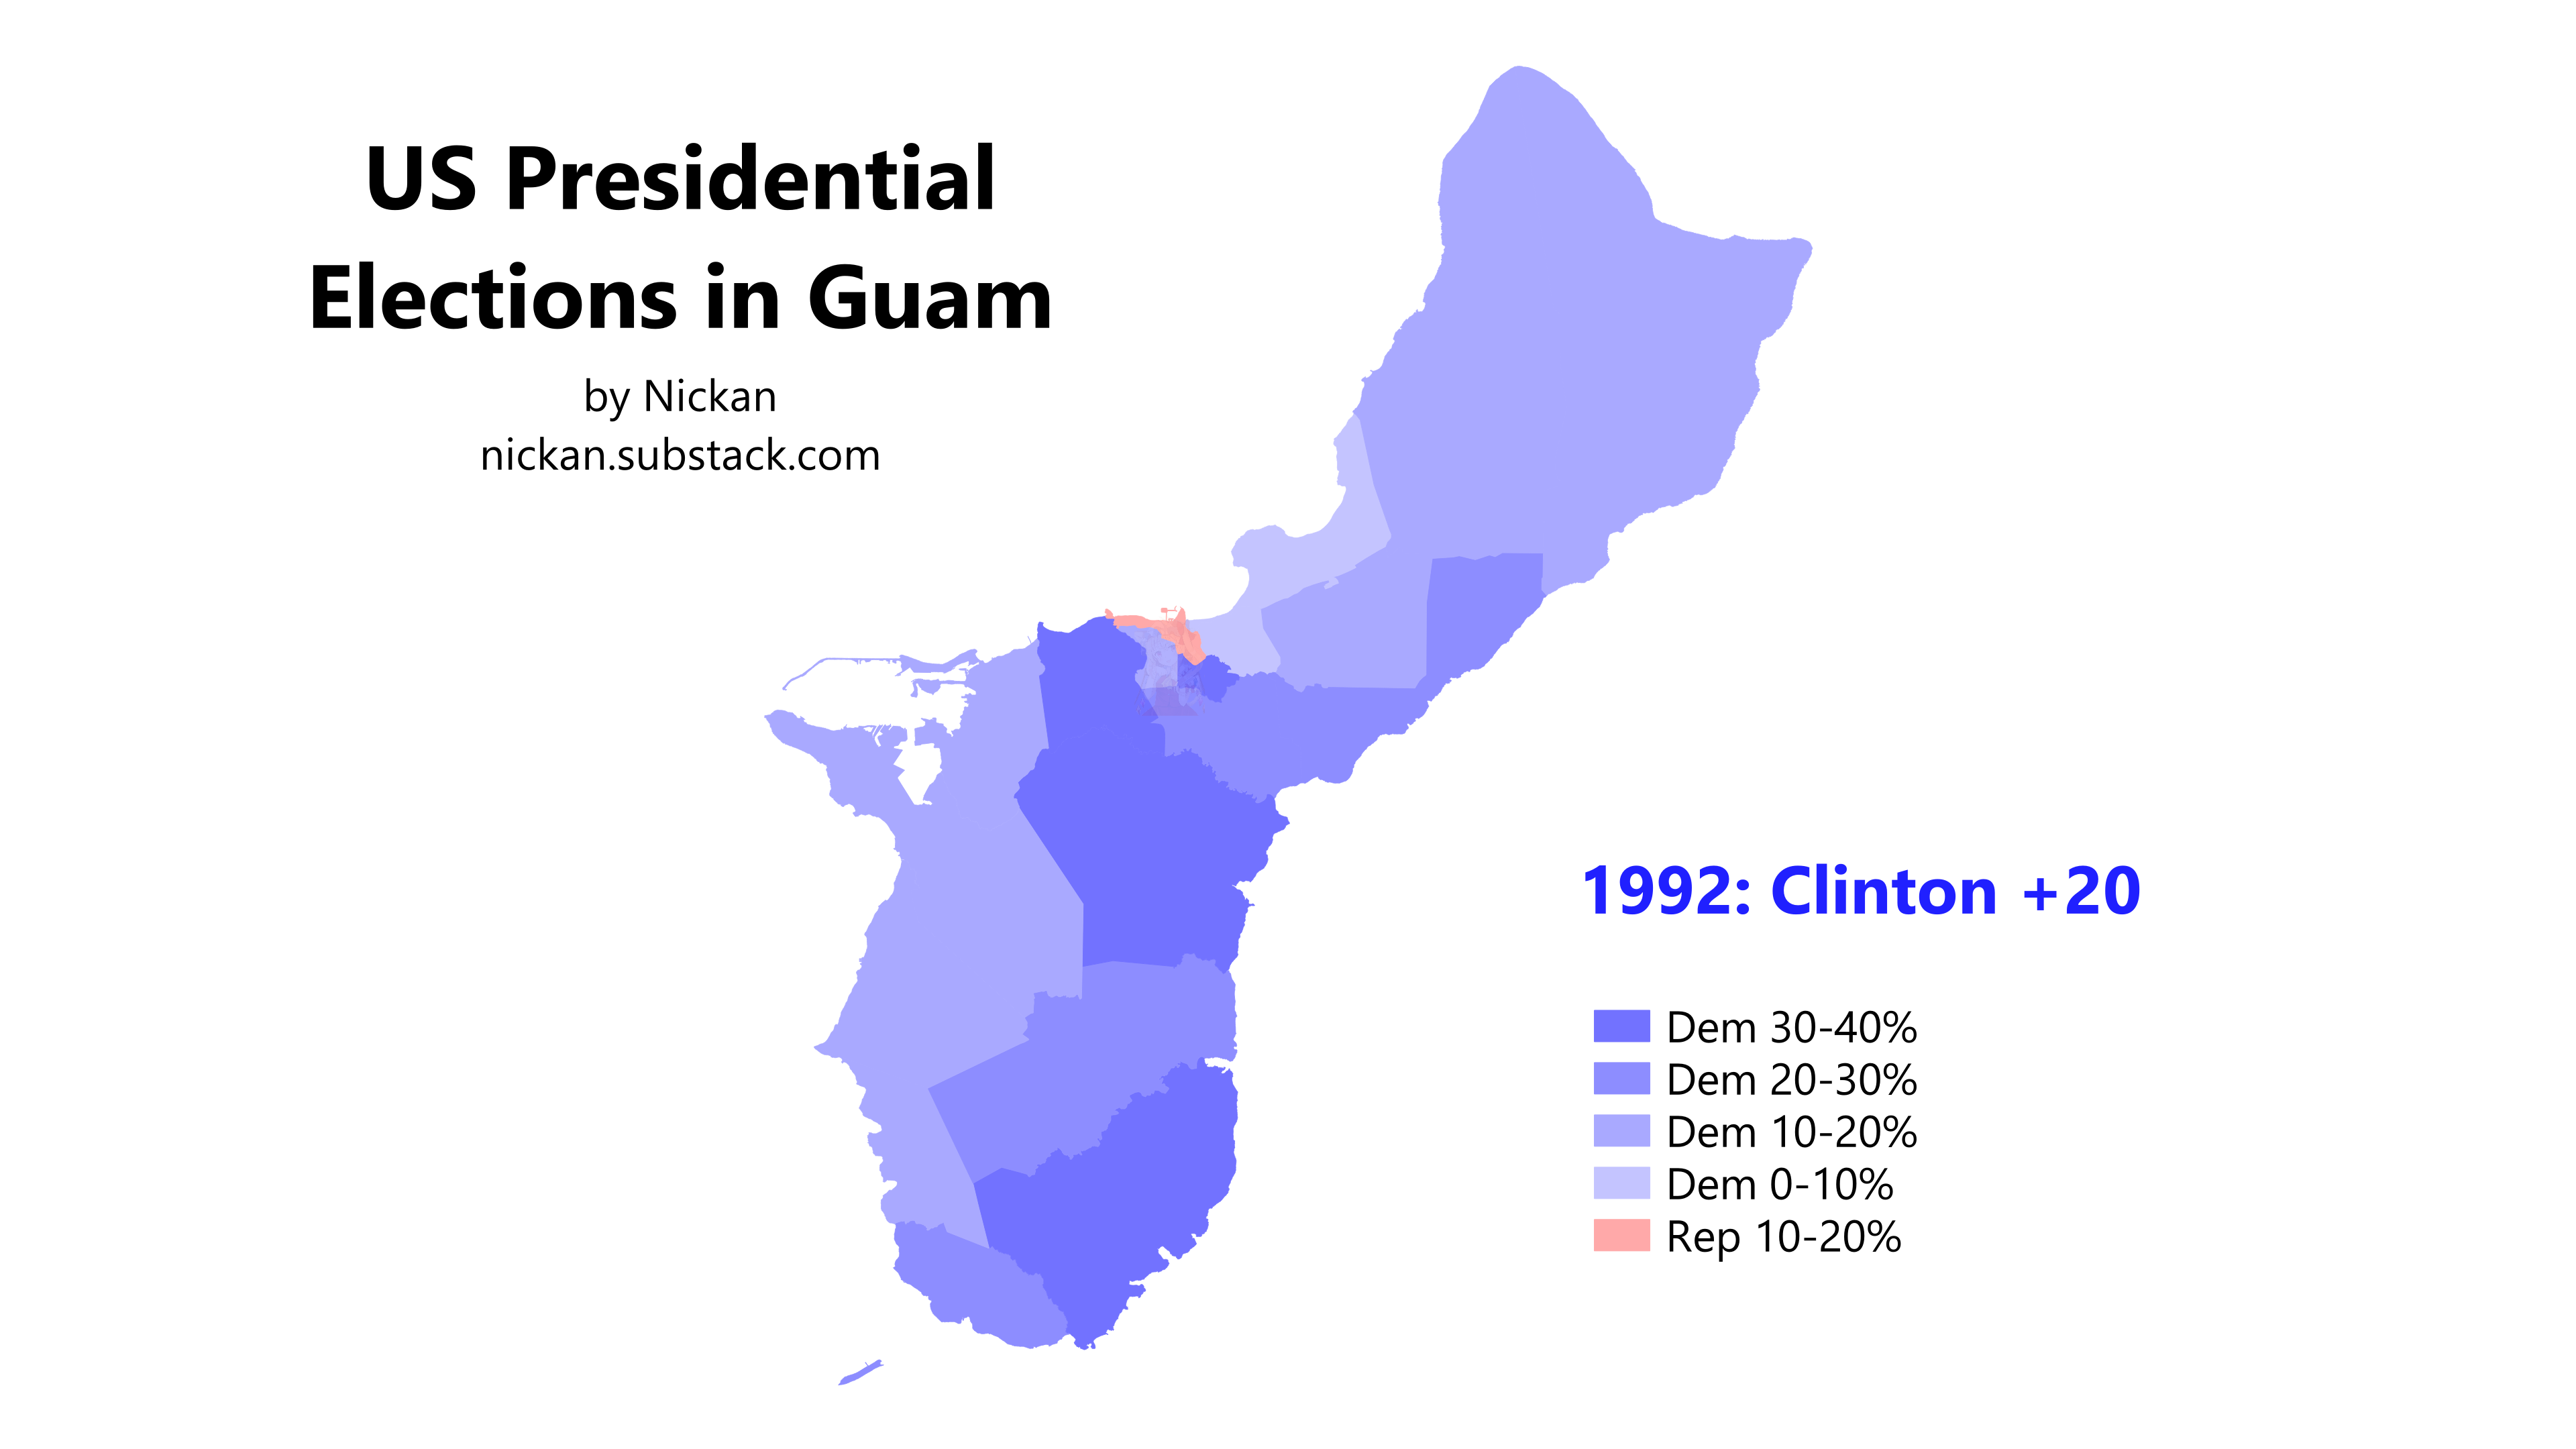
1992 saw another huge swing in Guam, this time back to the left as Bill Clinton carried the island by 20 pts alongside his nationwide victory. Independent Ross Perot, despite a strong nationwide performance, wasn’t on the ballot in Guam (nor would he be in 1996), with leftist Lenora Fulani and Libertarian Andre Marrou, each of whom took in less than 1%, being the only third-party candidates on the ballot. This 39-pt swing was driven by a 47-pt swing in Dededo, the island’s most populous village (though not its densest). Only Hagåtña remained red — and by double digits, as it swung “only” 26 pts to the left.
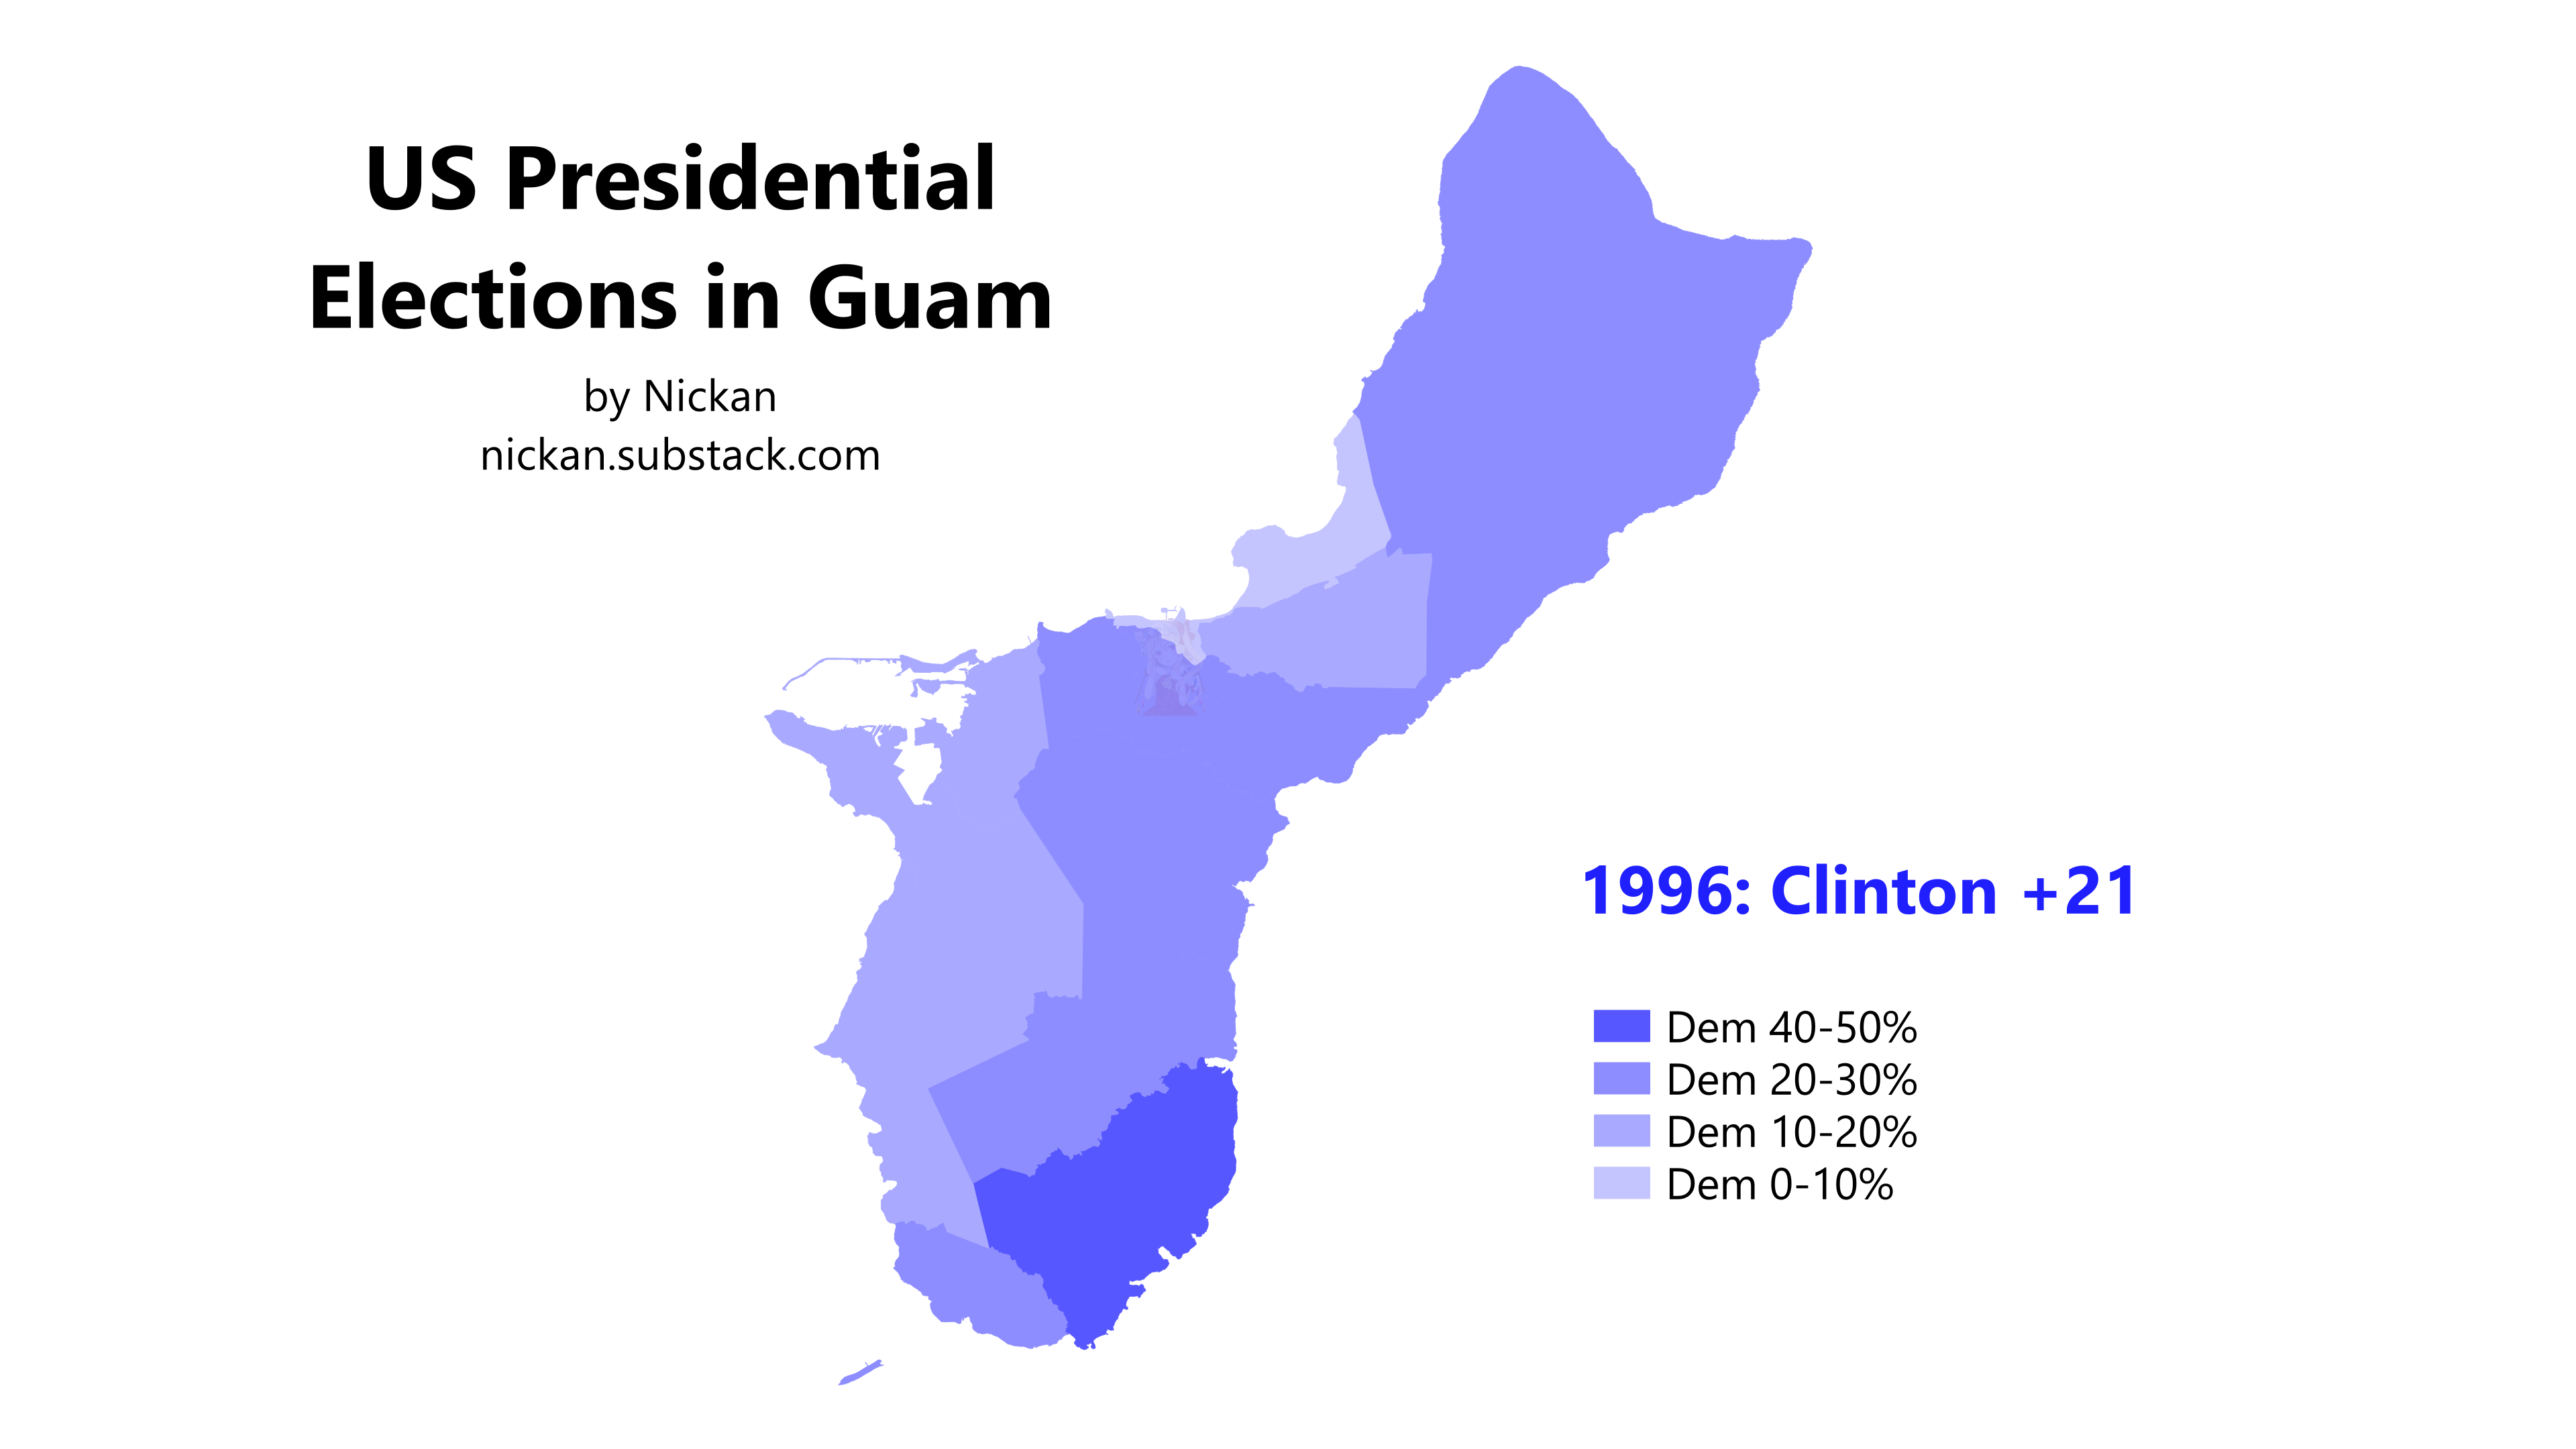
Clinton marginally expanded his victory in 1996, though village-level results shifted around to a much greater degree. Hagåtña swung 15 pts to the left to join the rest of the island in voting for Clinton, while Sinajana moved 12 pts to the right. Overall, 11 villages became bluer and 8 became redder. Northern Guam was the only area of the island to move consistently in one direction, with Barrigada, Mangilao, Tamuning, Dededo, and Yigo all swinging toward Clinton.
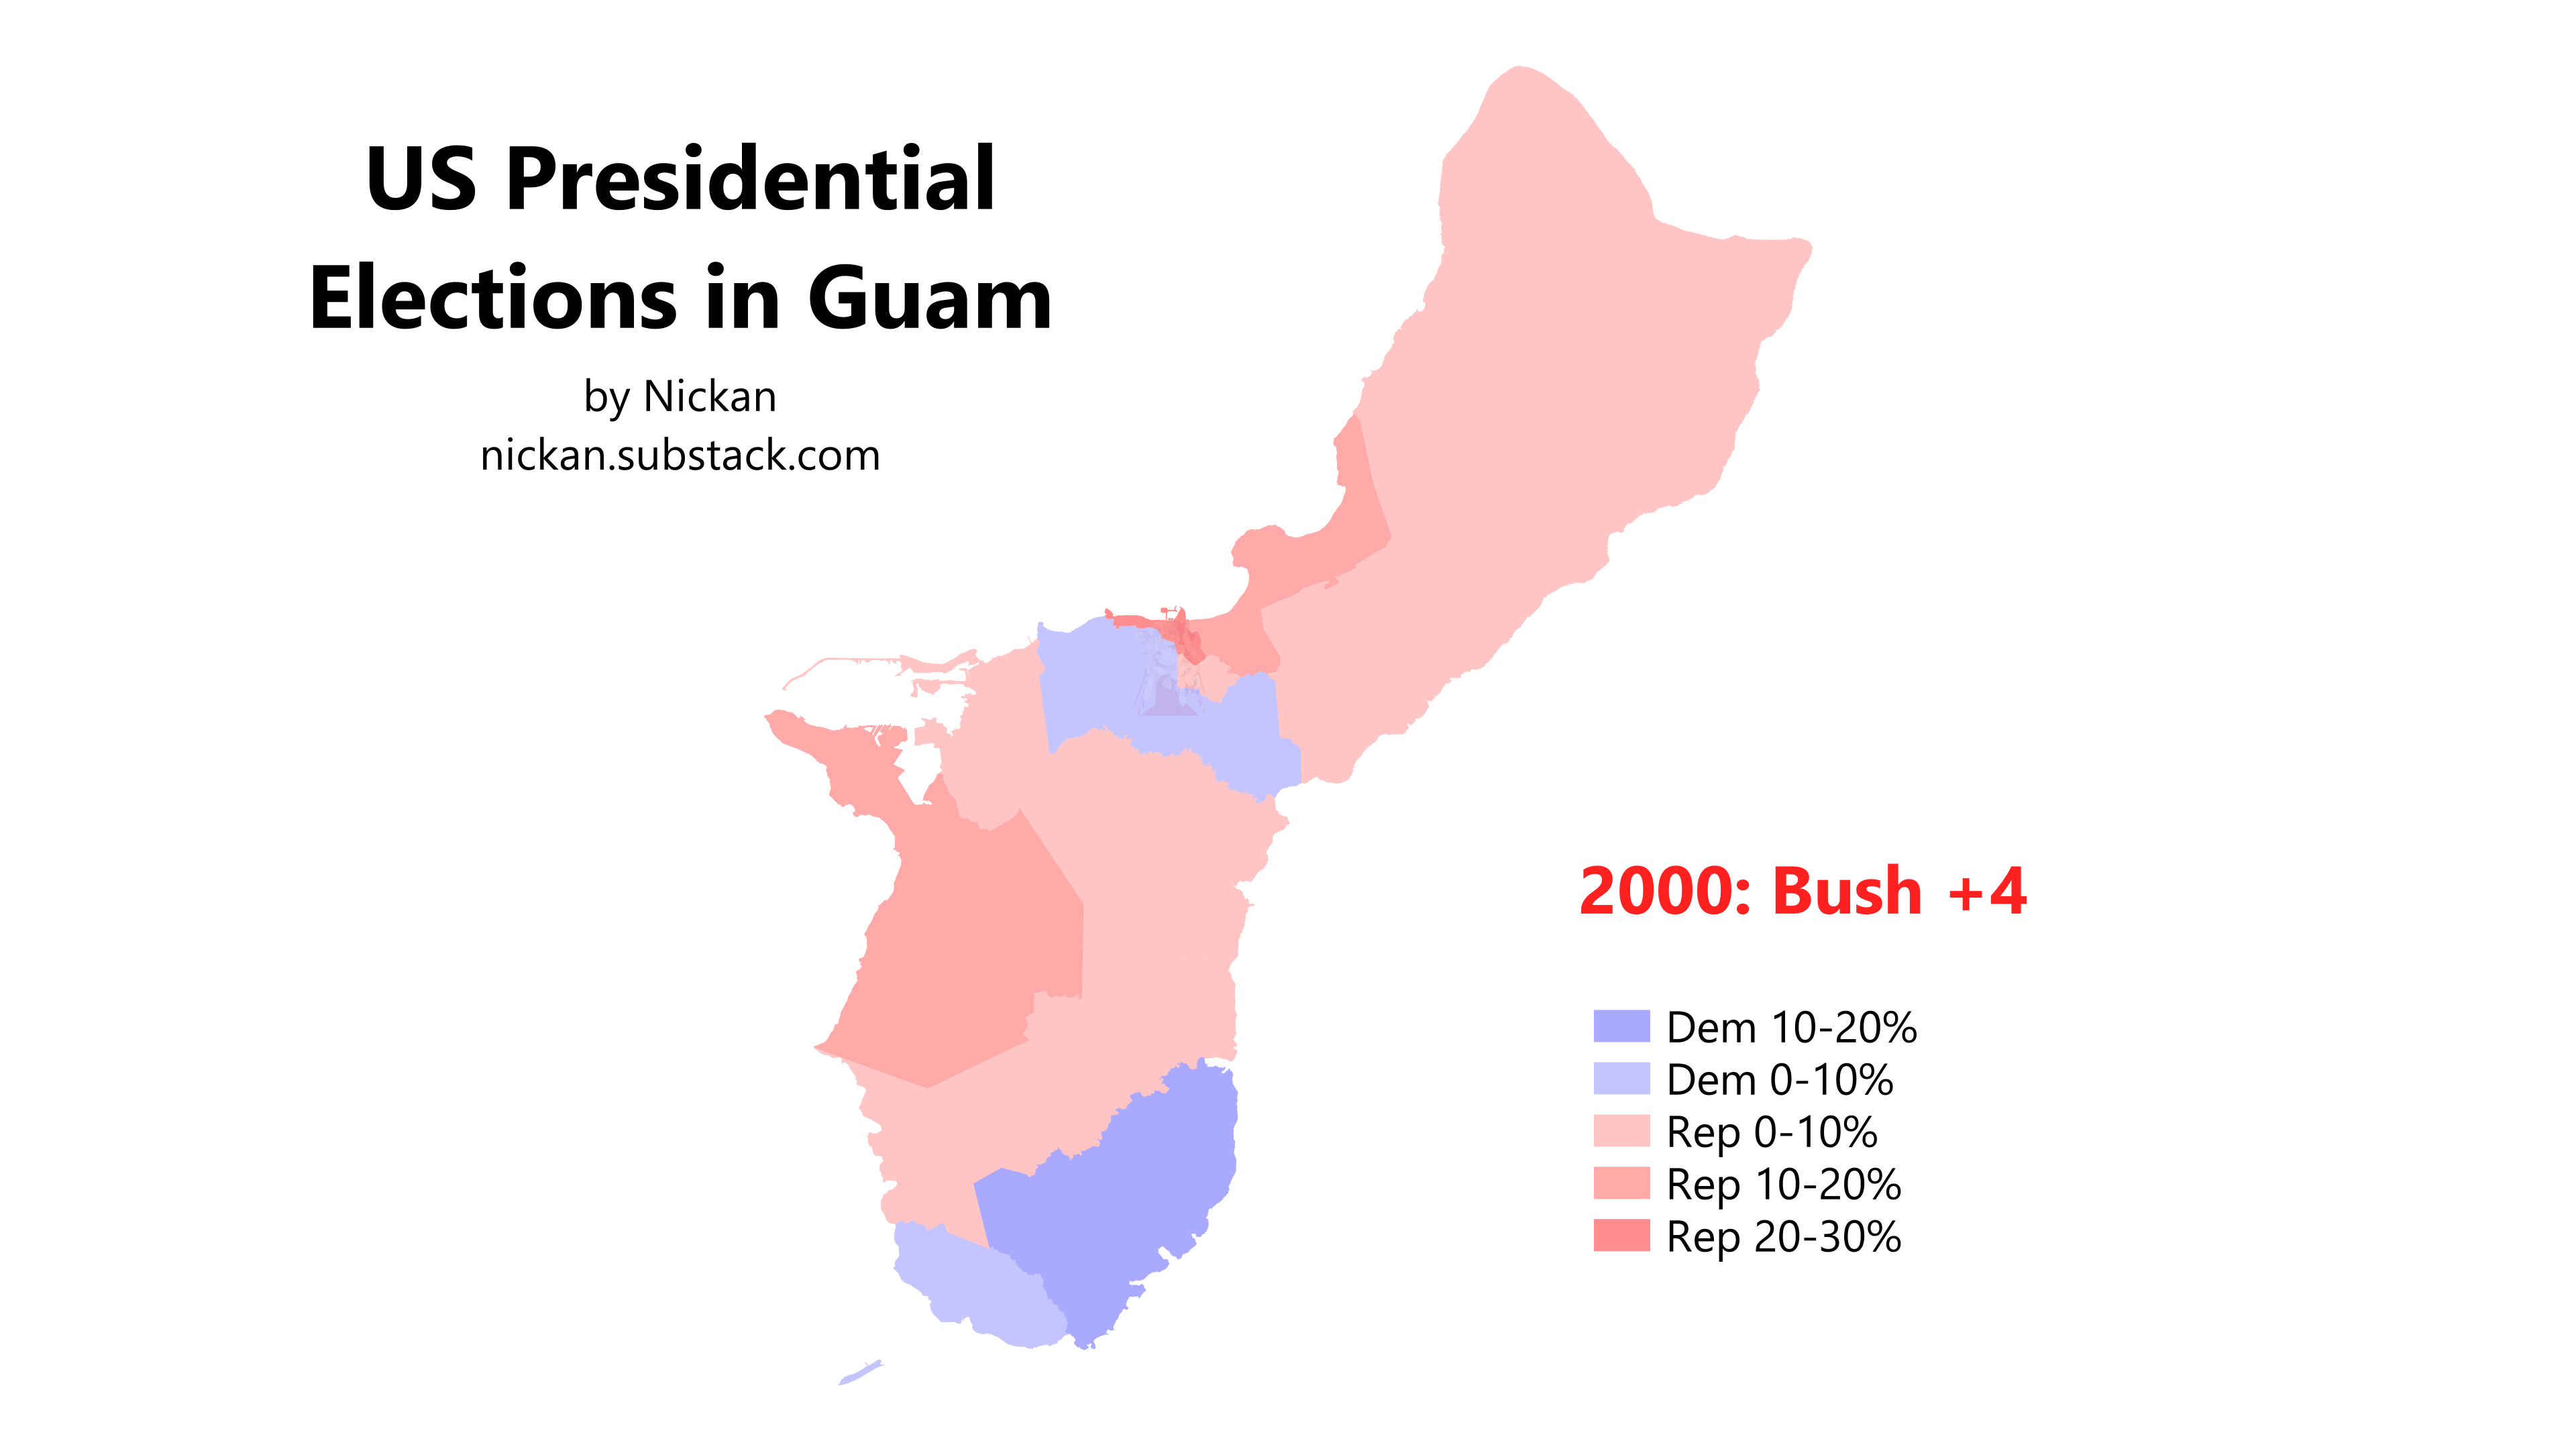
The 2000 election, infamously the narrowest in American history, would also be Guam’s closest on the presidential level — the only of these elections with a single-digit winning margin. George W. Bush won by just over 4 pts, though he carried 14 of 19 villages. Interestingly, this election result in particular exemplified demographic polarization to the extent that it existed: Hagåtña, Santa Rita, and Tamuning were the three reddest villages, while Inalåhan and Merizo (the latter being the second most heavily CHamoru village) were the two bluest, though Inalåhan stood out, with its 18-pt victory margin for Al Gore placing it over 13 pts to the left of every other village.
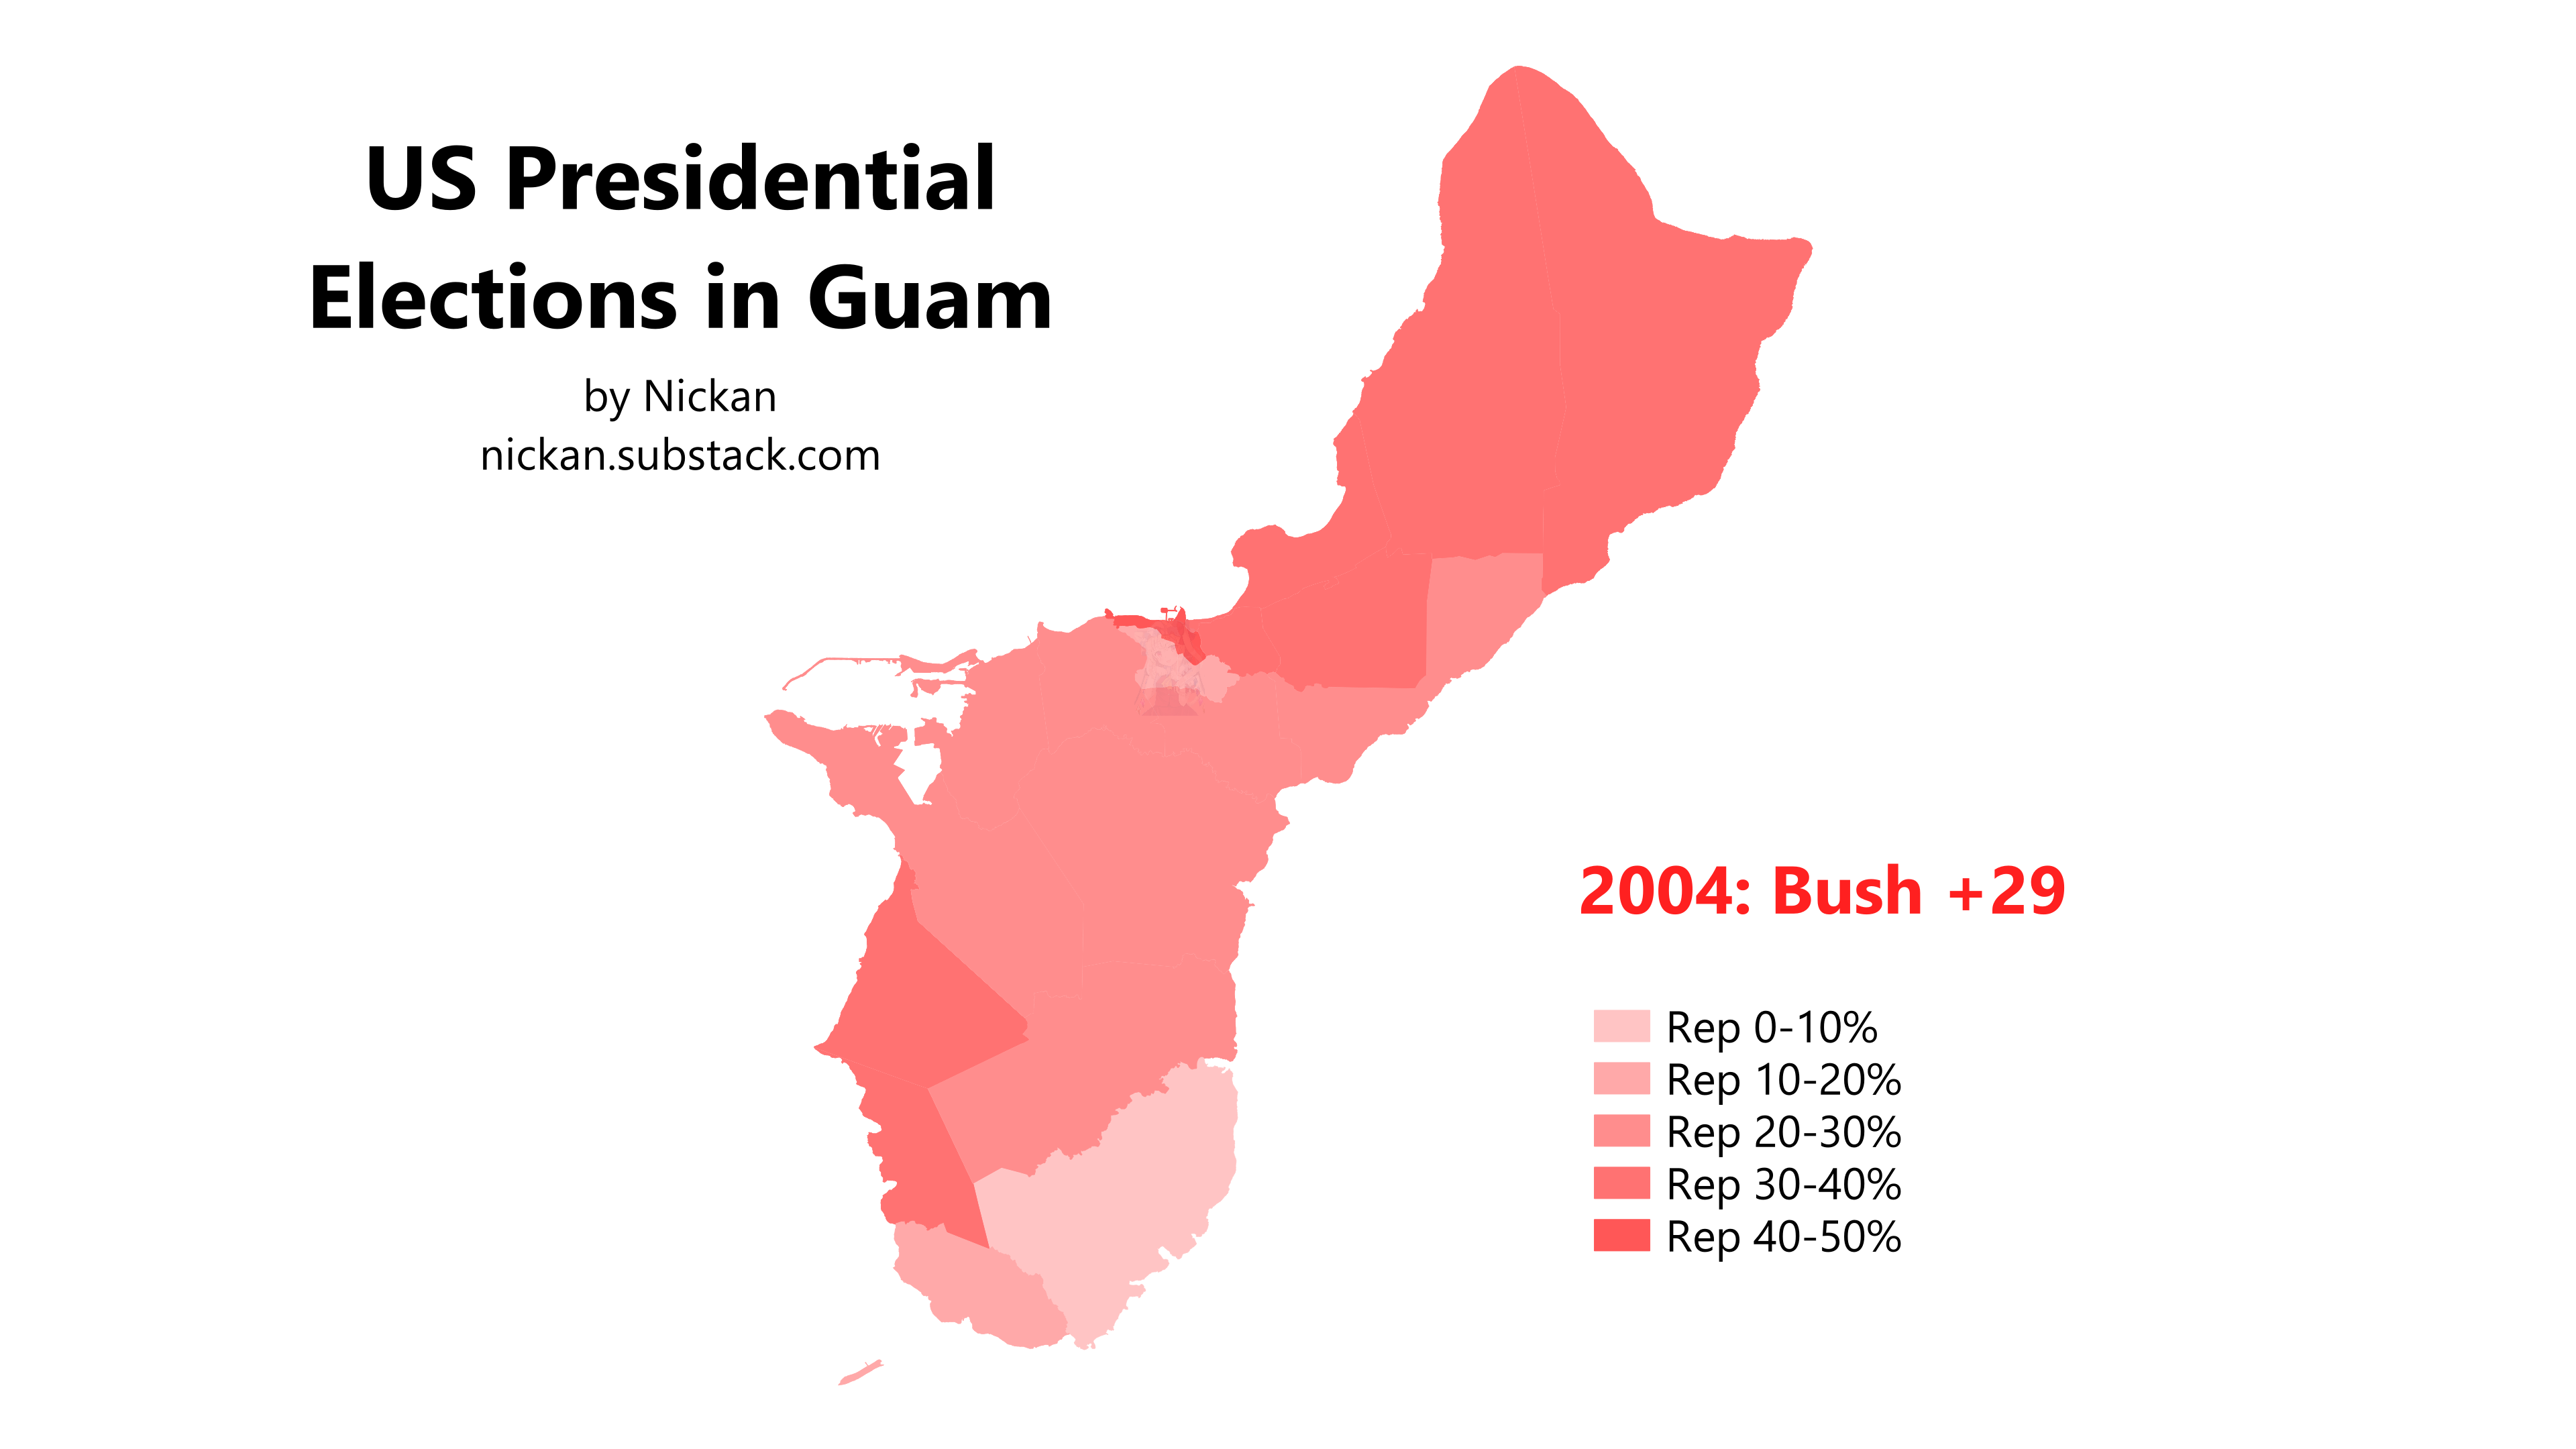
Though Bush’s nationwide victory in 2004 was only a marginal shift from 2000, Guam swung 25 pts to the right that year. Every village went red and every village moved toward Bush by double digits. Like in Reagan’s similarly overwhelming landslide 20 years earlier, Inalåhan was the bluest village and Hagåtña was the reddest, but in a sign of surprisingly reduced polarization, there was only a 33-pt gap between the two, compared to a 50-pt one in 1984 (Inalåhan moved from Reagan +3 to Bush +8, while Hagåtña dropped from Reagan +52 to Bush +41).

The 2008 election saw Guam’s biggest swing in history, as the island surged 54 pts to the left to deliver Barack Obama a 25-pt victory. For the first time since 1980, Inalåhan wasn’t the bluest village, as neighboring Merizo outpaced it by just under 2 pts, swinging 65 pts to get there. Only in Hagåtña did Obama struggle, winning by 2 pts there — a margin of victory of only 9 votes. That same year, the Guam legislature flipped from an 8-7 Republican majority to a 10-5 Democratic supermajority.
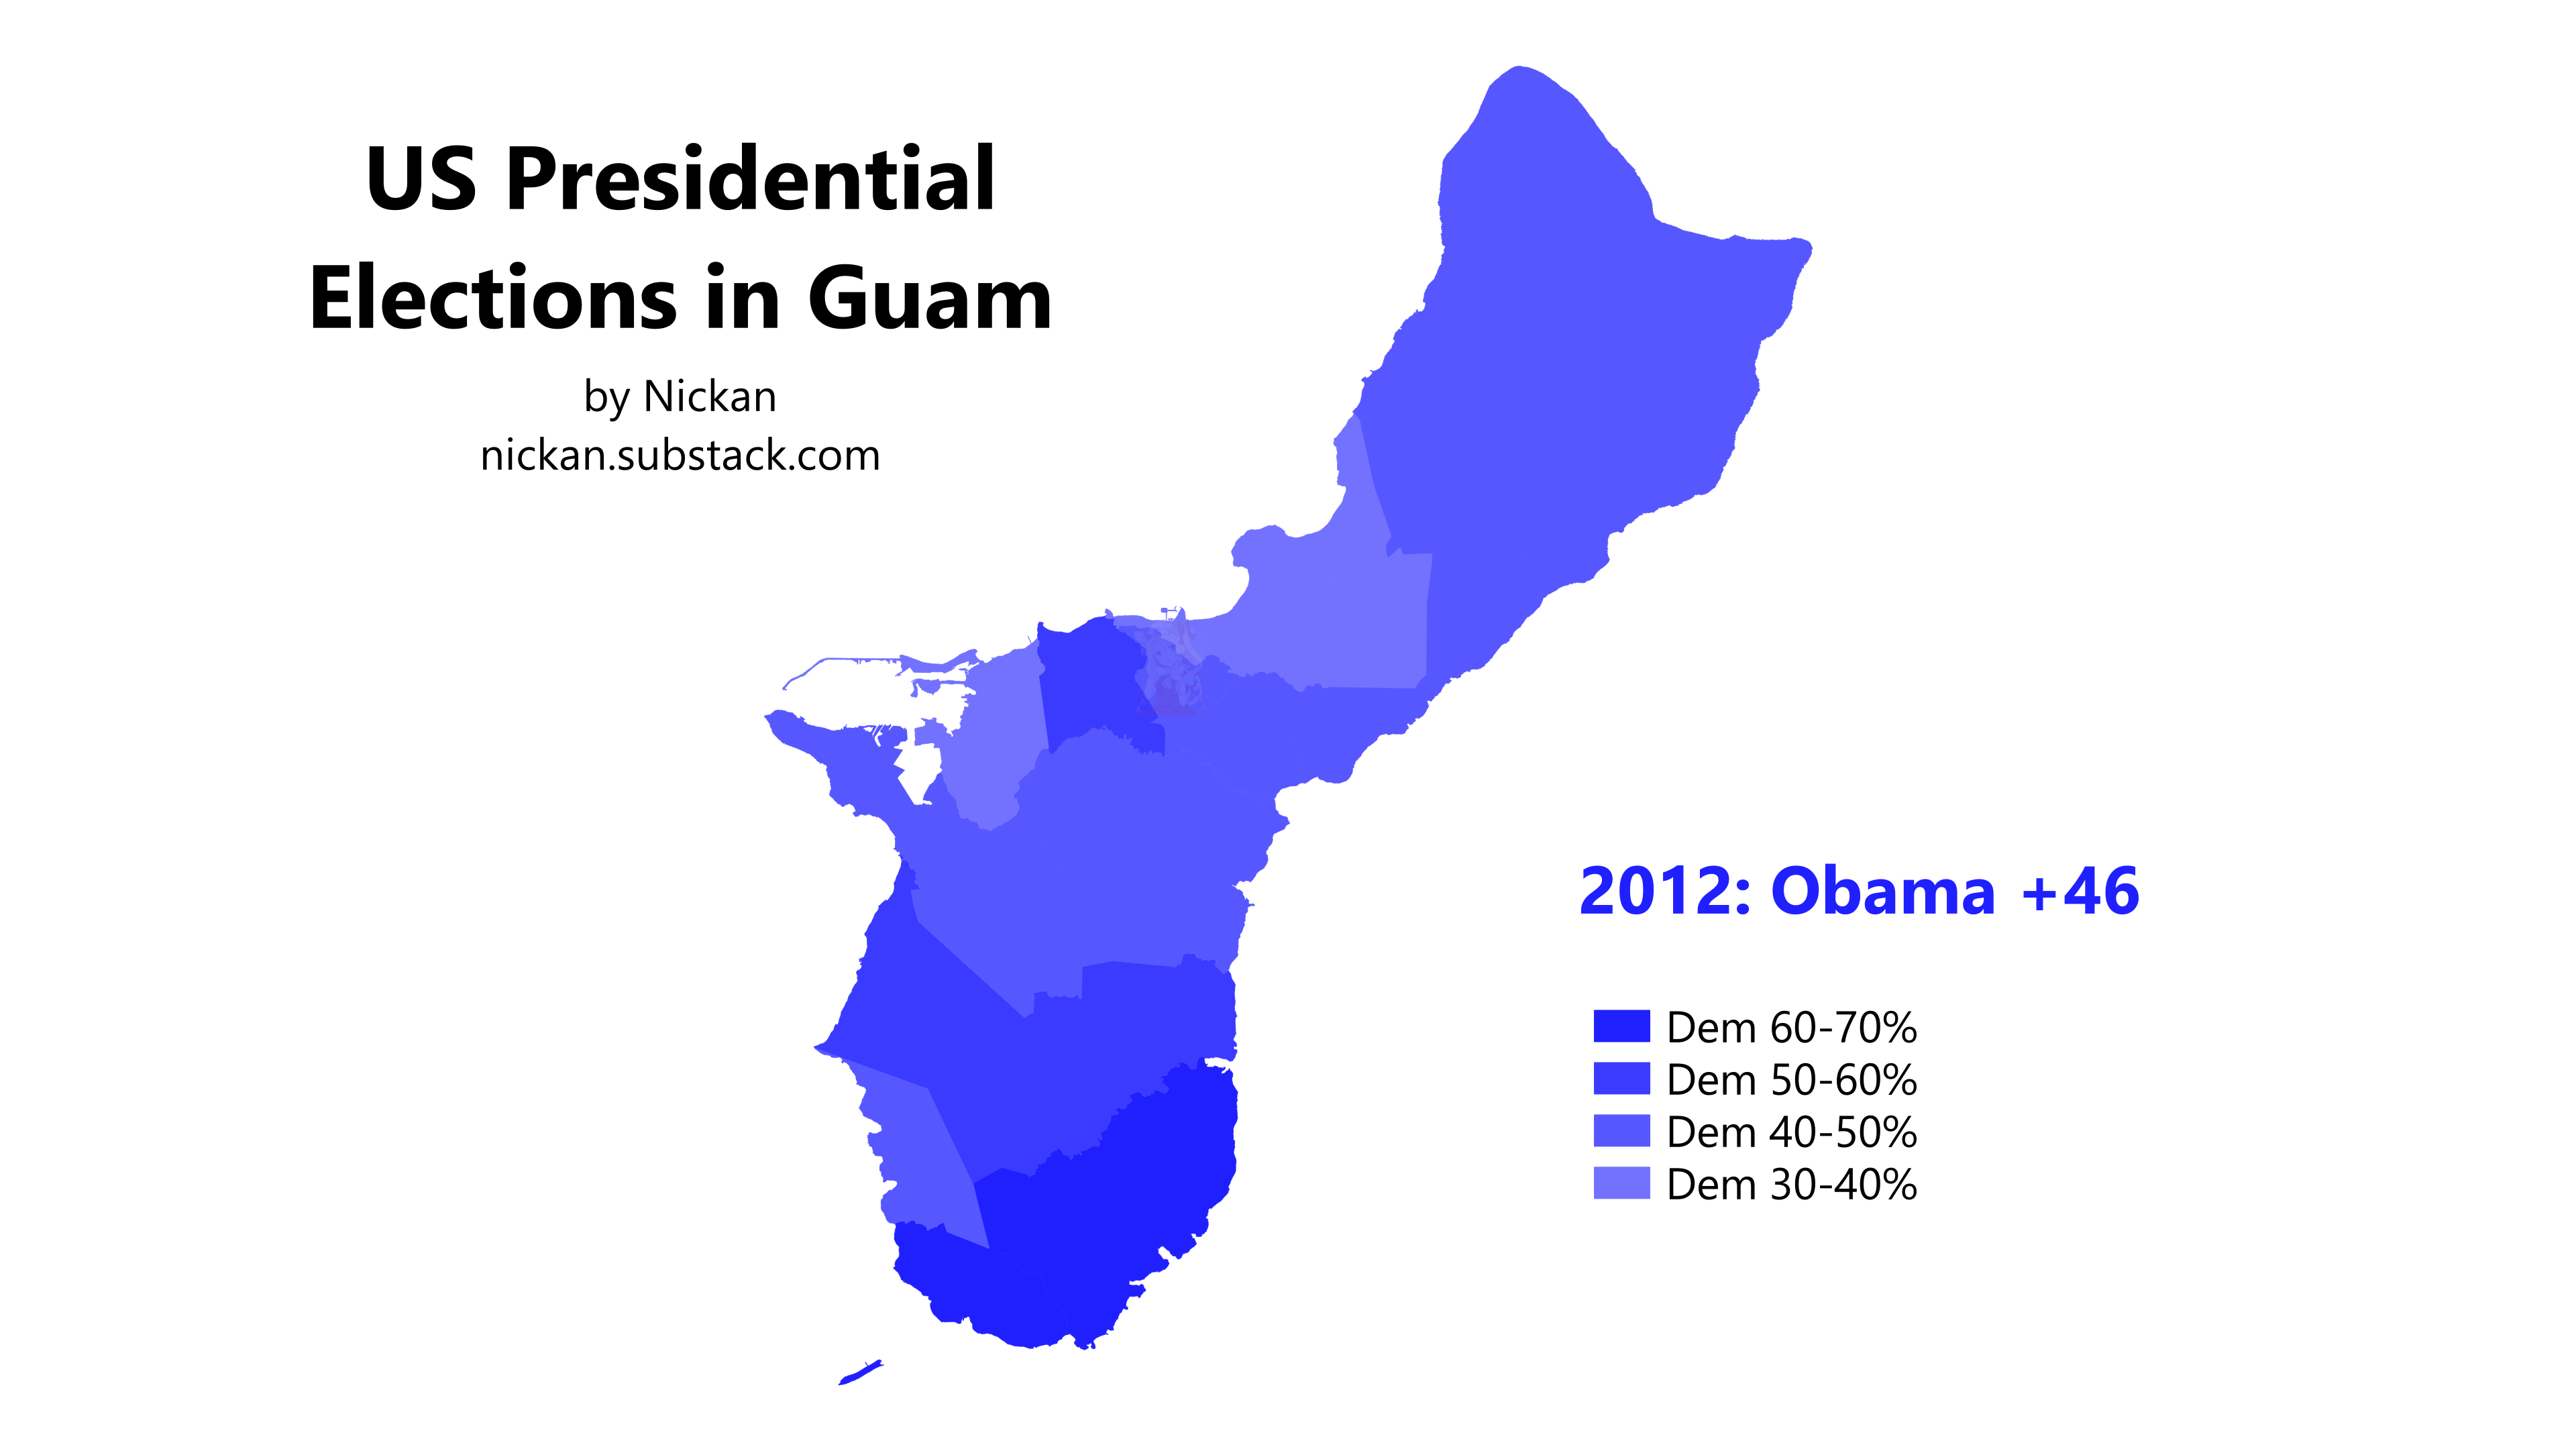
Guam extended its record of delivering huge victories for incumbent Democrats in 2012, with Obama winning a record-breaking 73% of votes, hitting at least 65% in every village and reaching over 80% in Merizo and Inalåhan. This victory was perhaps bolstered by the assistance Guam received under the 2009 American Recovery and Reinvestment Act, wherein the territory received over $100 million of funds to help weatherize homes and lower energy costs.
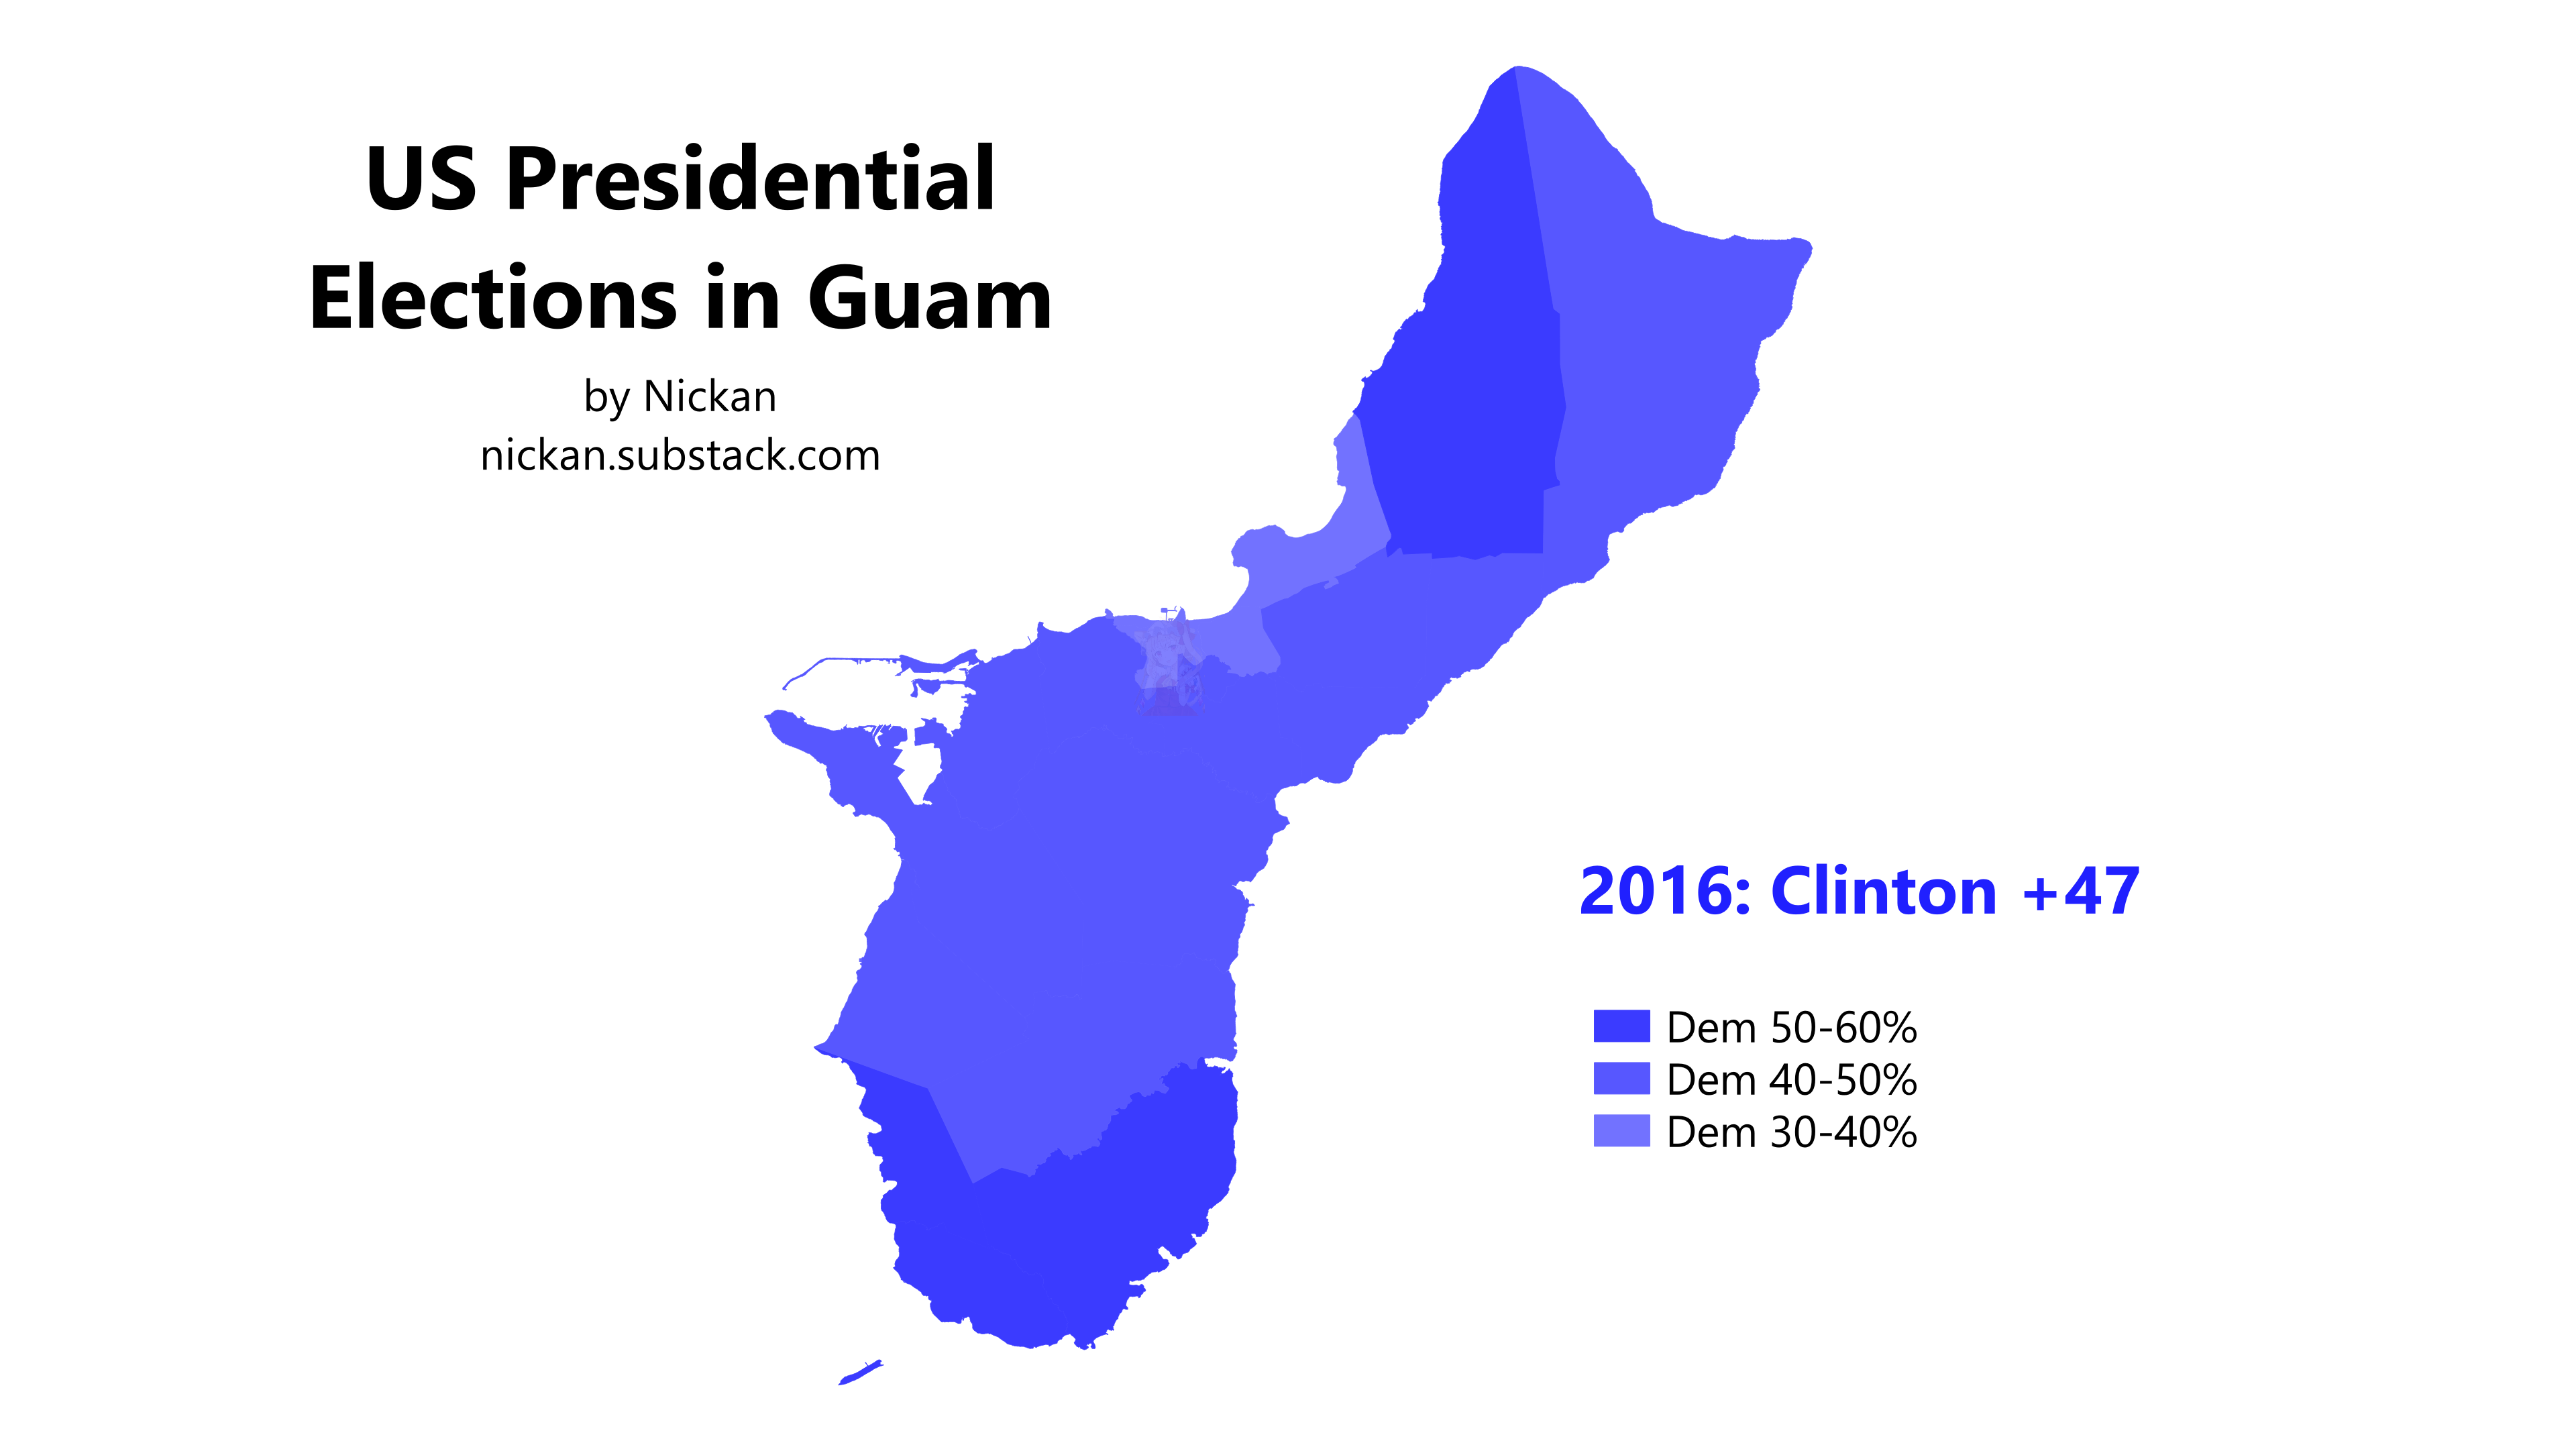
Though her actual vote share was marginally lower than Obama’s, Hillary Clinton broke the record for margin of victory in a Guamanian presidential election, with a 47-pt blowout of Donald Trump in 2016. Though some village-level results moved around, these changes seemed inconsistent, with Merizo for example swinging 11 pts to the right while its demographically similar neighbor Umatac swung 11 pts to the left. Notably, this result ended Guam’s decades-long streak of voting for the nationwide winner, and it clearly did so in dramatic fashion.
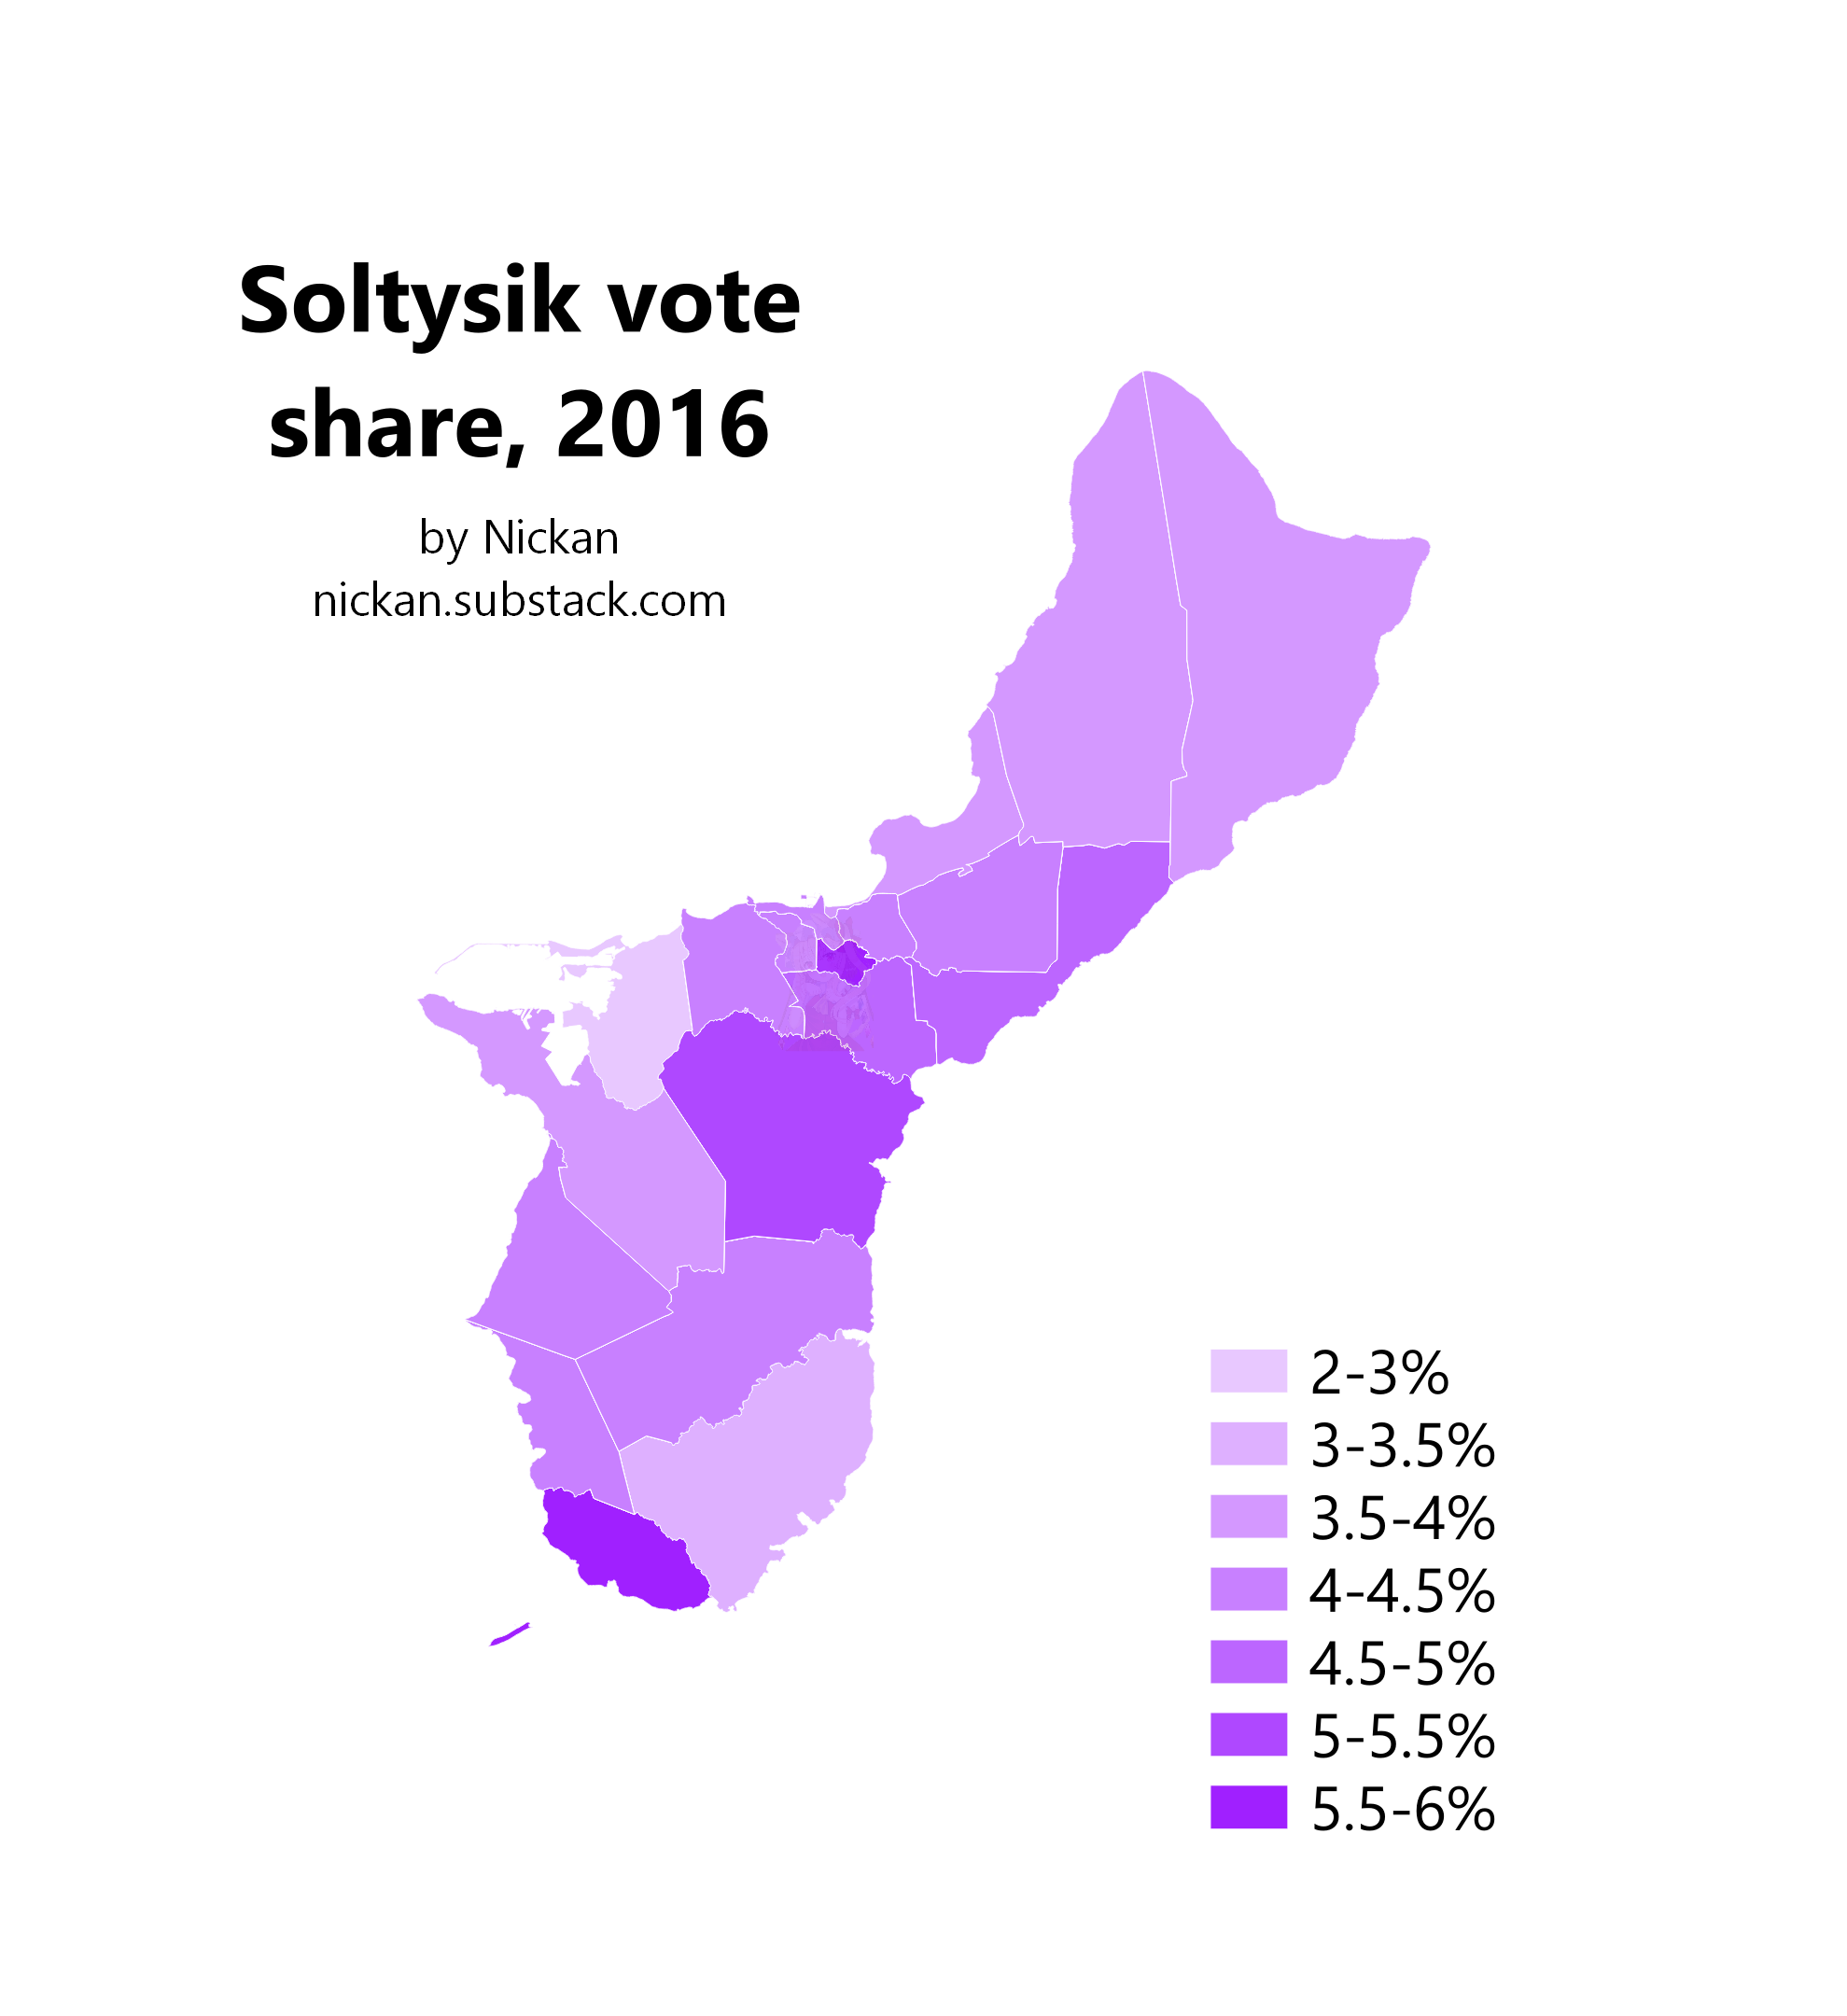
This election also featured the best performance of any third-party candidate in Guam, with Socialist Party USA candidate Mimi Soltysik, the only other candidate on the ballot, taking 4.2% of the vote, his 1.4k votes representing over a third of his nationwide total, as he only appeared on two states’ ballots (Colorado and Michigan). The geographic distribution of his vote share is displayed below, with his best performance coming in Sinajana, where he won 5.8%.
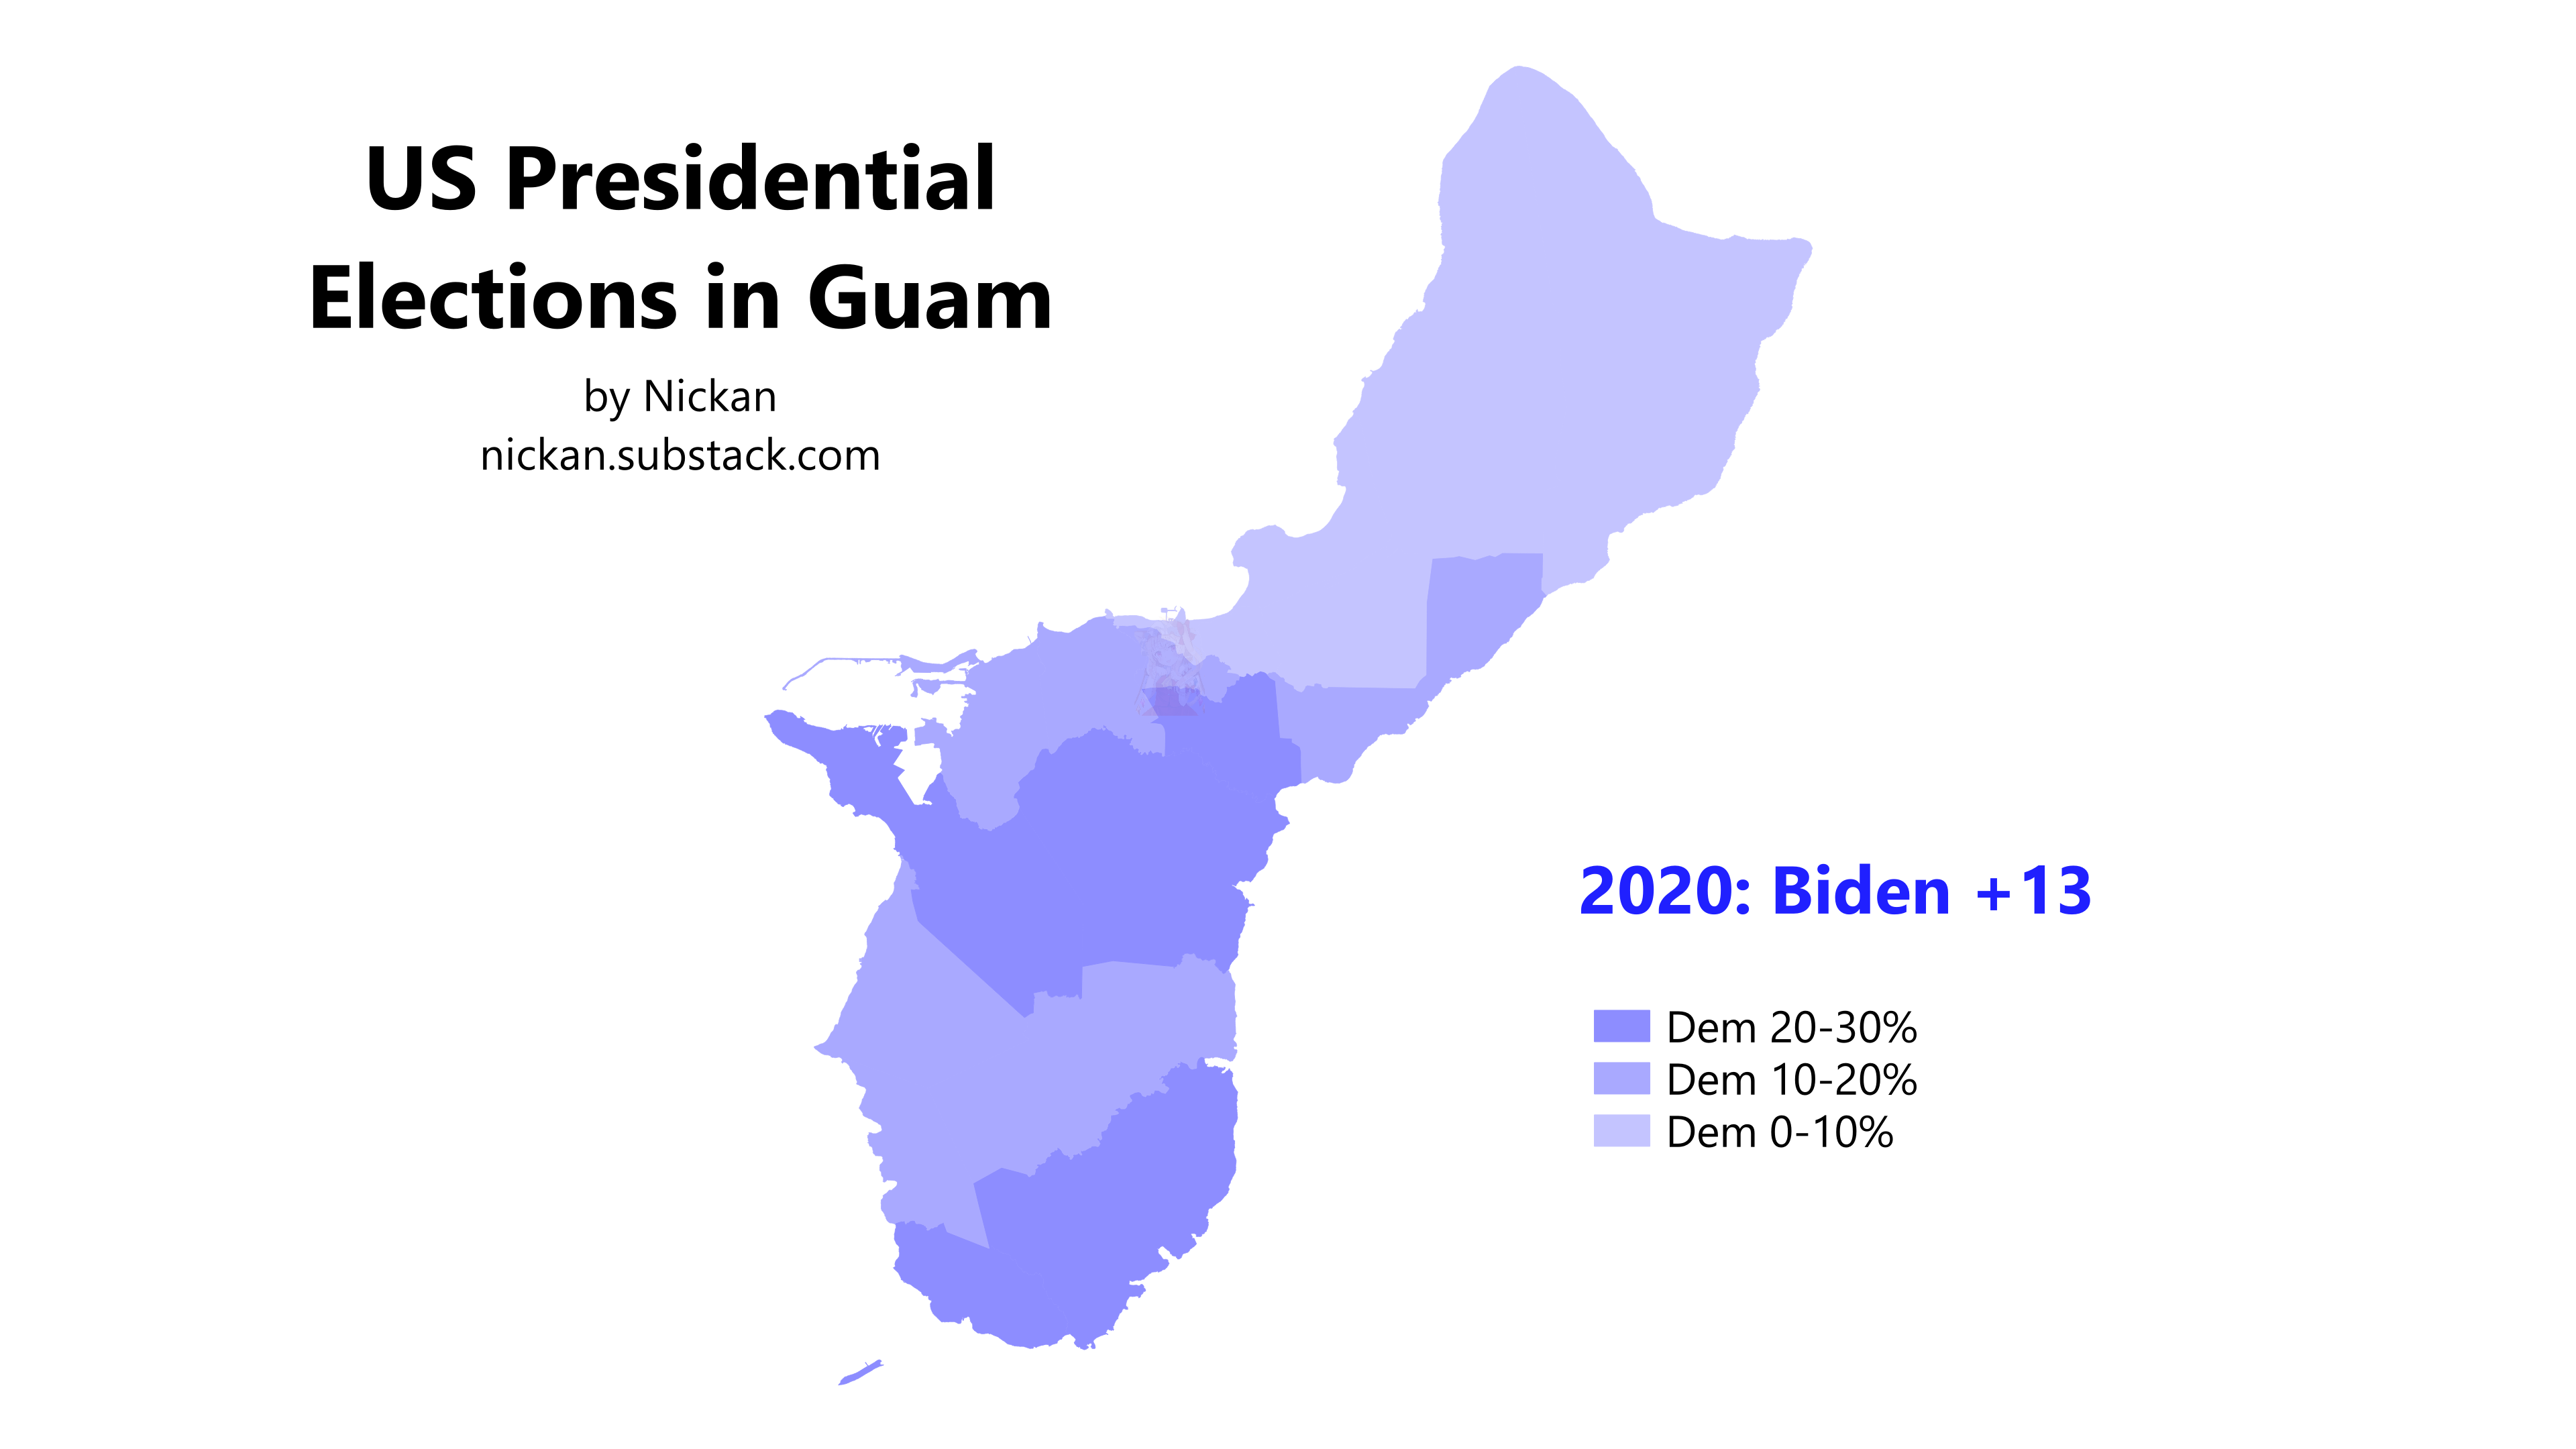
The Trump administration had a rocky relationship with Guam — for example, in 2017, it sued the territorial government over its its indigenous land trust program — though it has also released funds and grants to the island. Nevertheless, Guam’s 2020 results mirrored a nationwide trend of Democratic slippage among voters of color, and while Biden still comfortably won Guam, sweeping every village, his margin of victory was significantly reduced from Clinton’s 2016 win.
For the first time since 2004, Inalåhan returned to its position as Guam’s bluest village, but Hagåtña became only the fifth reddest after nine straight elections being the reddest, with Yigo, Tamuning, Barrigada, and Mongmong-Toto-Maite voting to its right.
This was also the first election to feature more than two third-party candidates, as Howie Hawkins of the Green Party, Jo Jorgensen of the Libertarian Party, Green dissident Dario Hunter, American Solidarity Party candidate Brian Carroll, and Prohibitionist Phil Collins (not to be confused with the world-famous musician) all appeared on the ballot. Hawkins was the top third-party vote getter with 0.7% of the vote. Here’s what a results map would look like if Biden and Trump were removed:
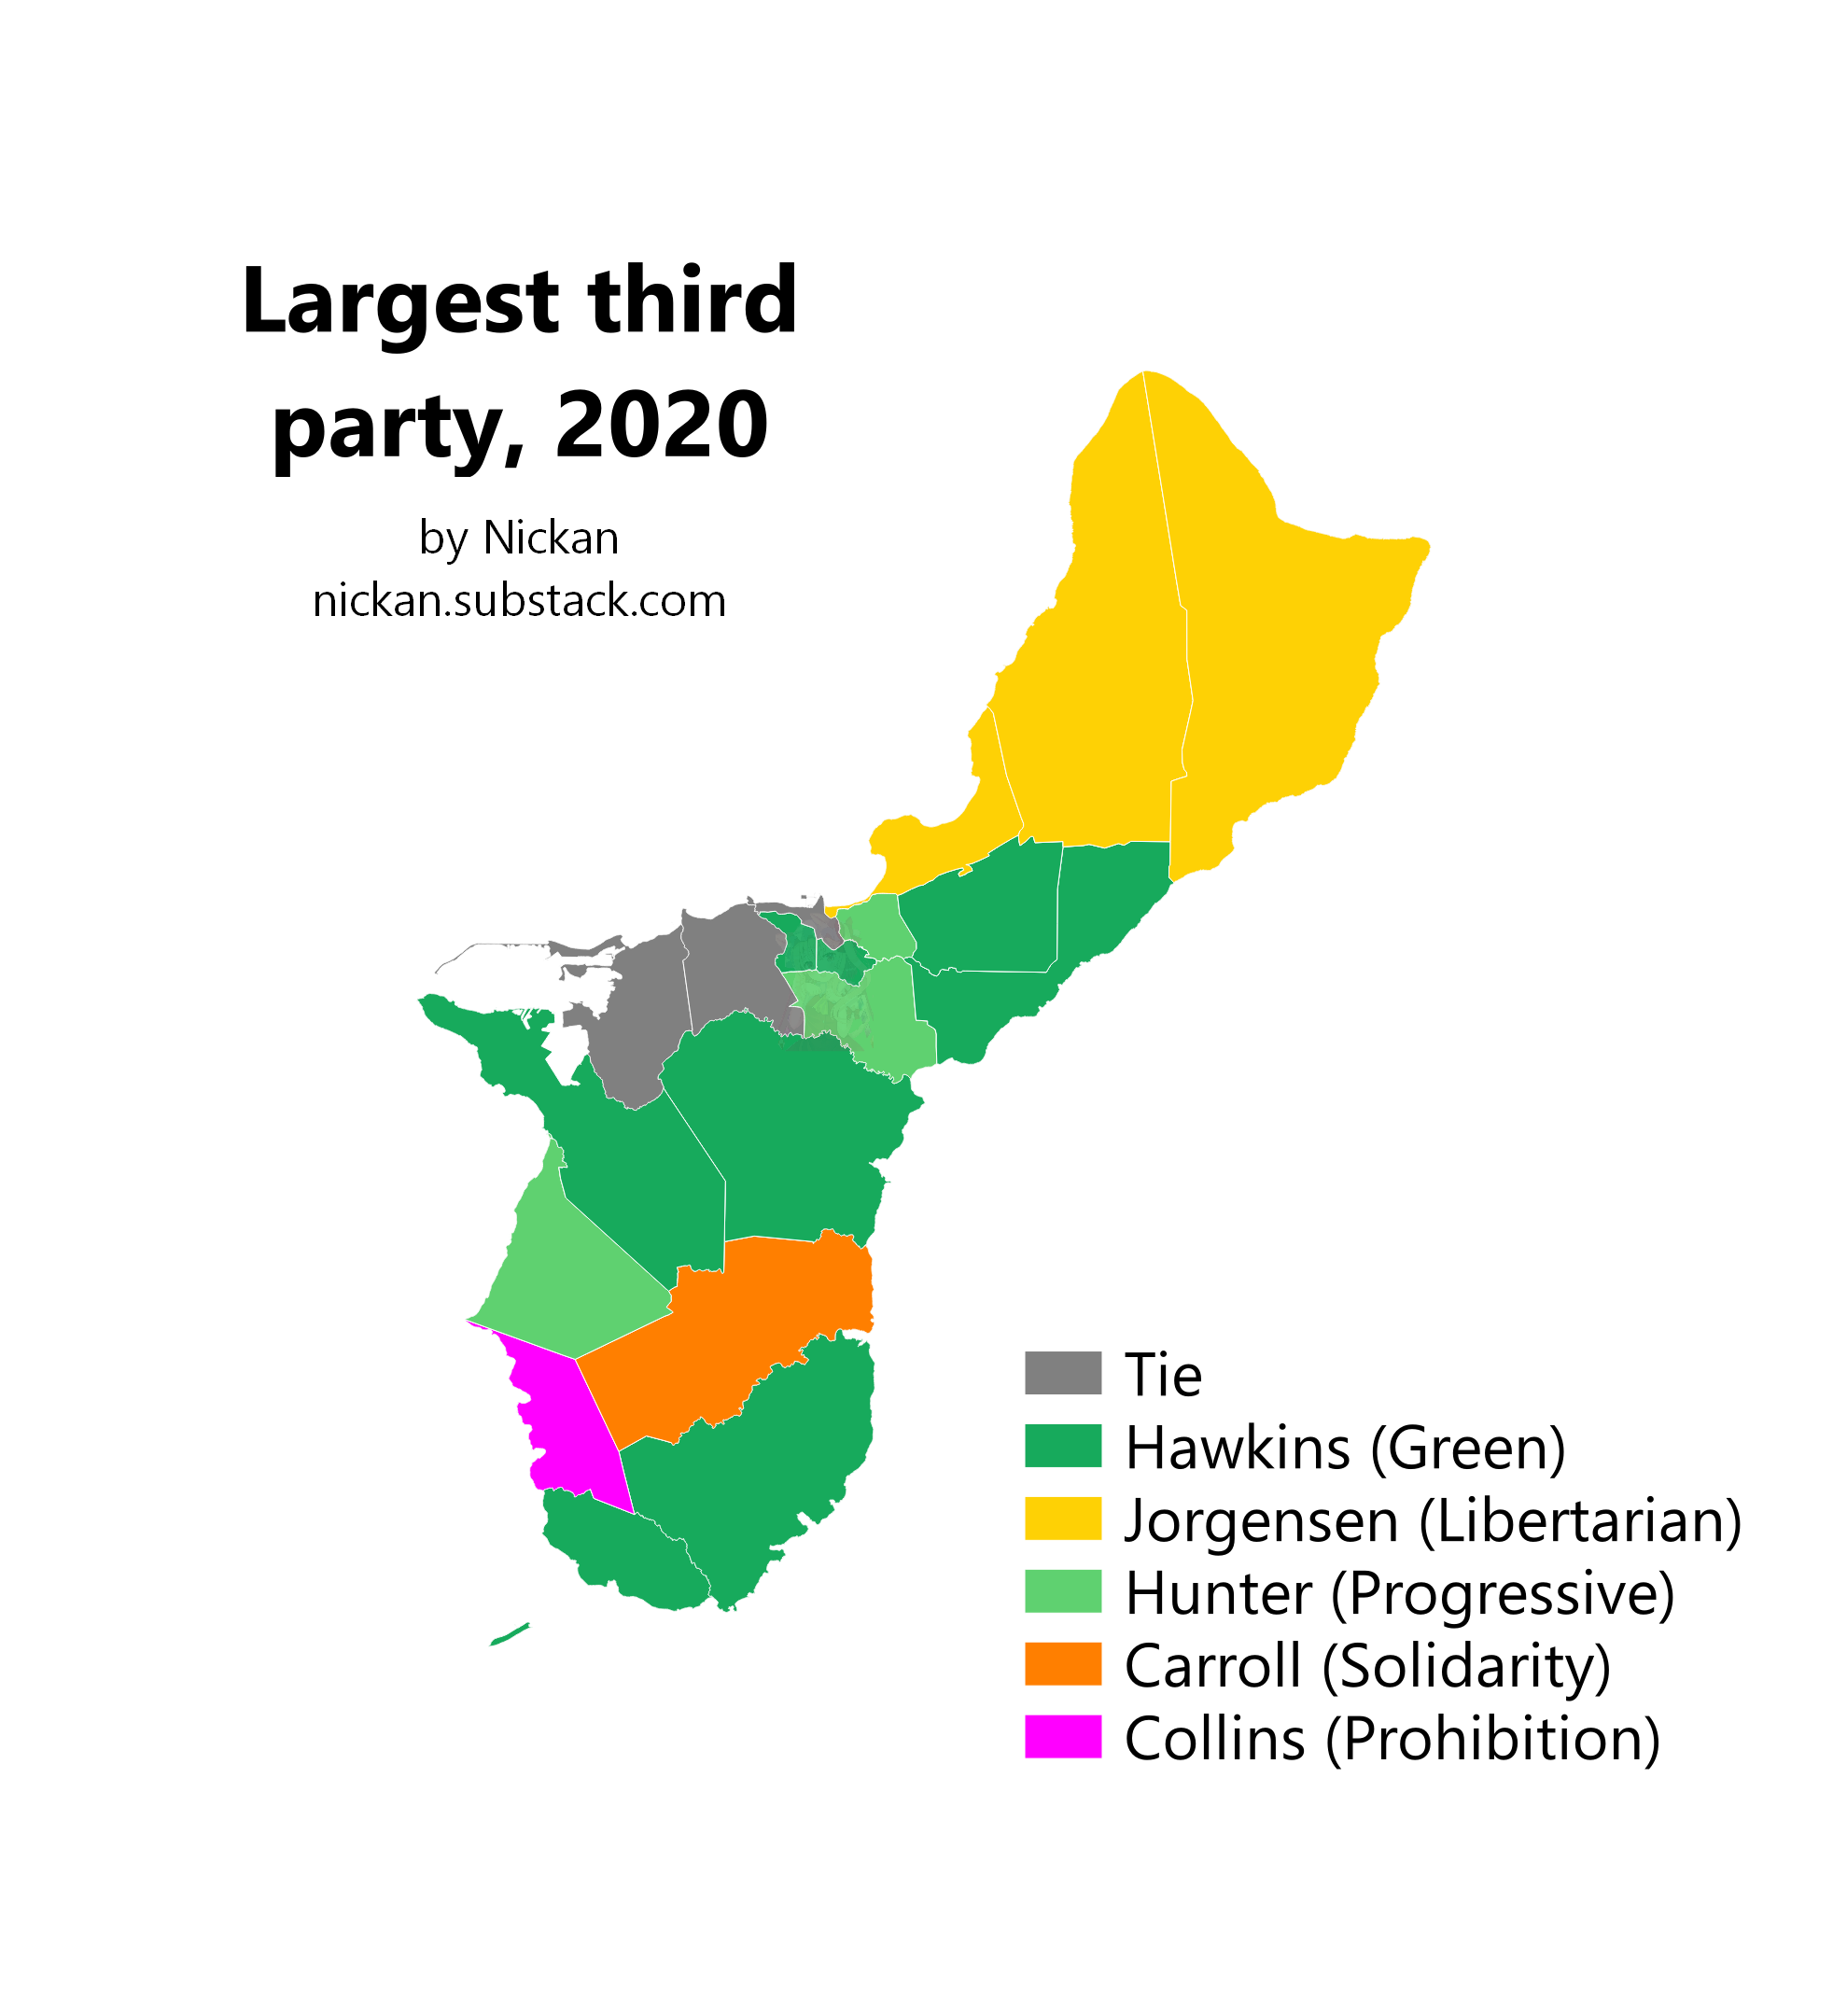
Among third-party candidates, Jorgensen dominated the north of the island, while Hawkins won most of the rest, with three villages going to Hunter and one apiece to Carroll and Collins.
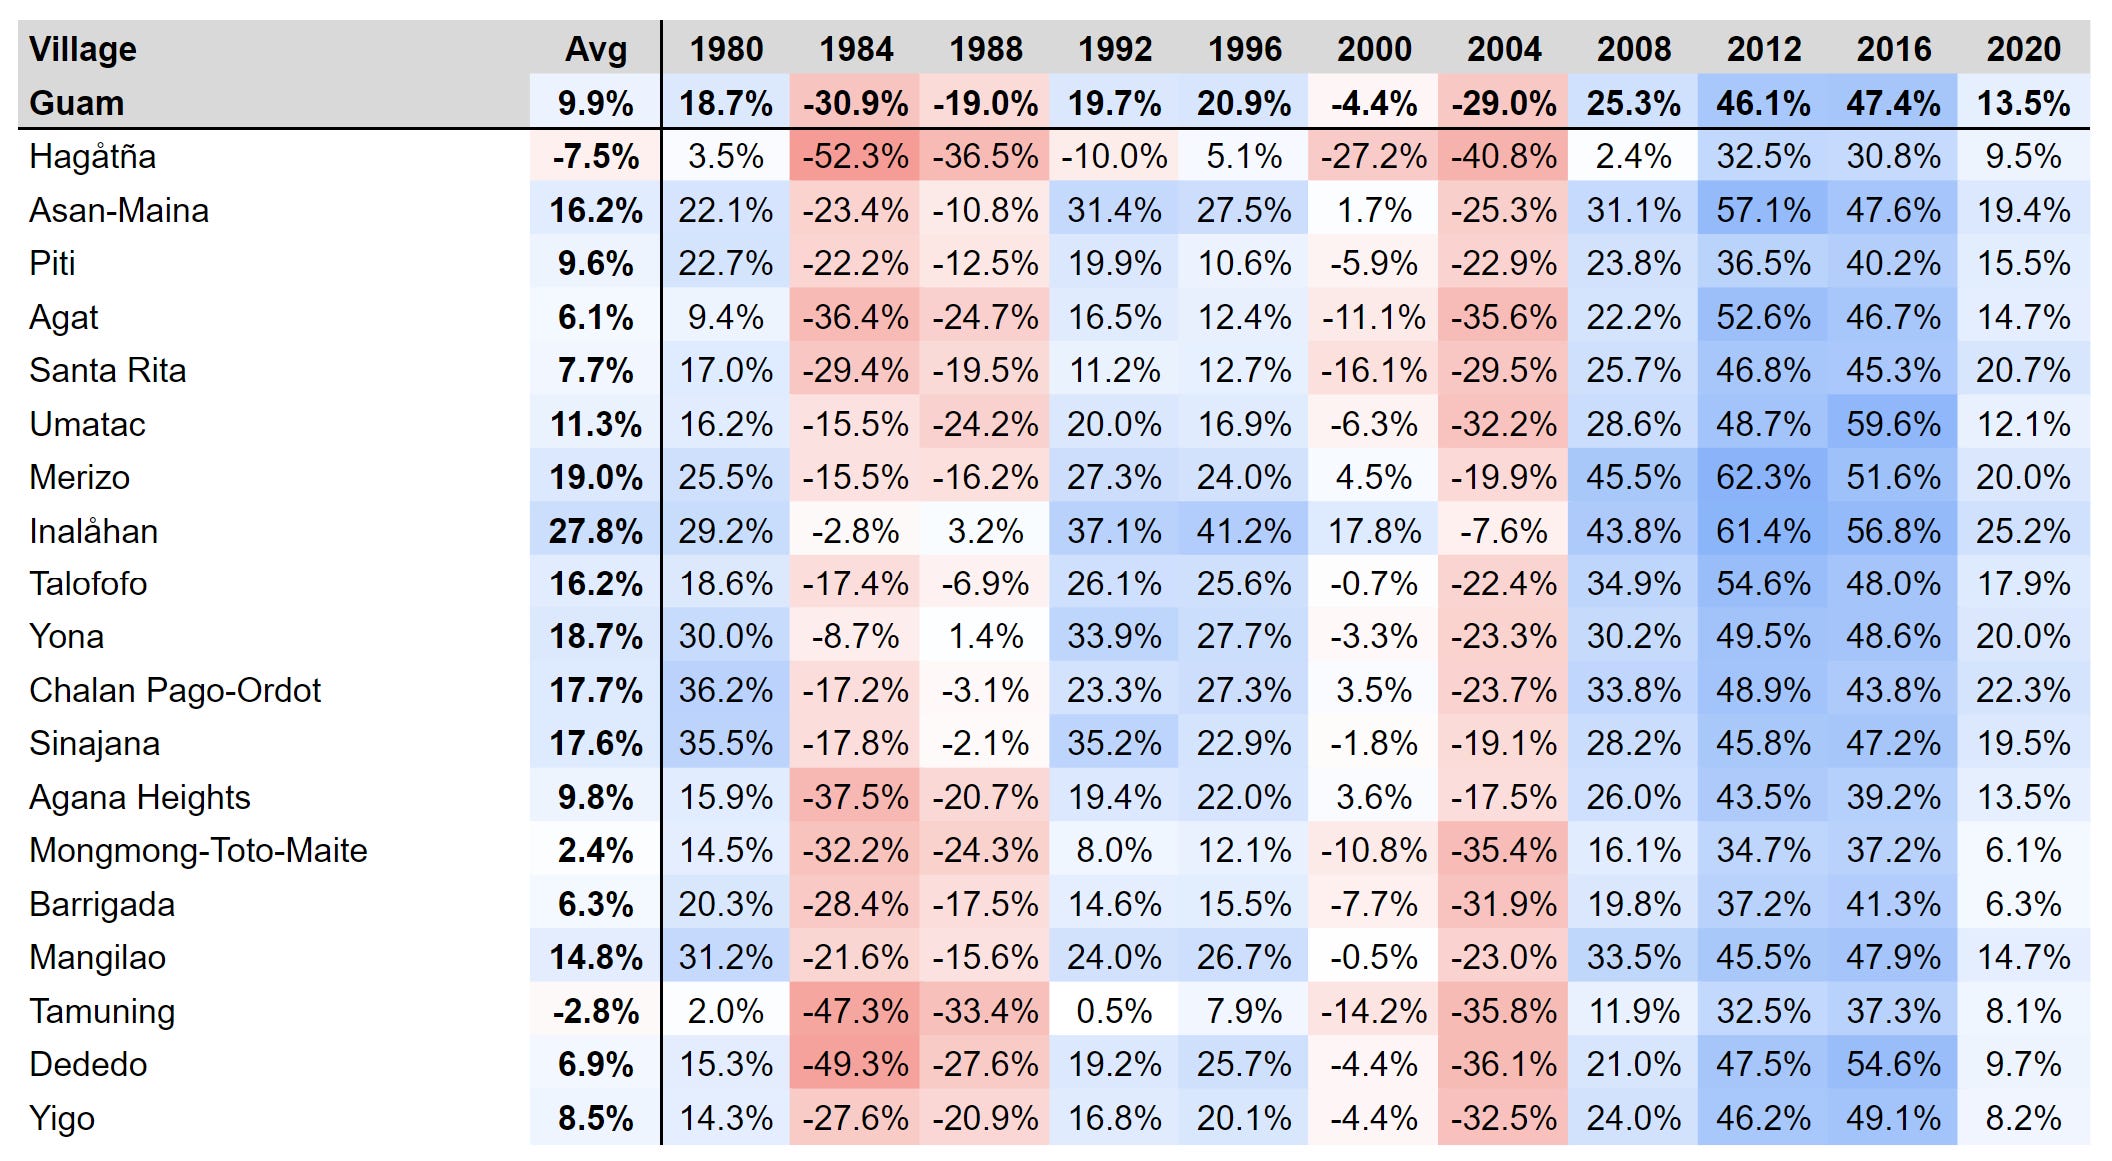
If you’ve made it this far through the article, I commend you. We’re almost there. With all these elections in consideration, below are some charts summarizing the series of results. Hagåtña and Tamuning were the consistently reddest villages, while Inalåhan was by far the bluest on average.
Margin:
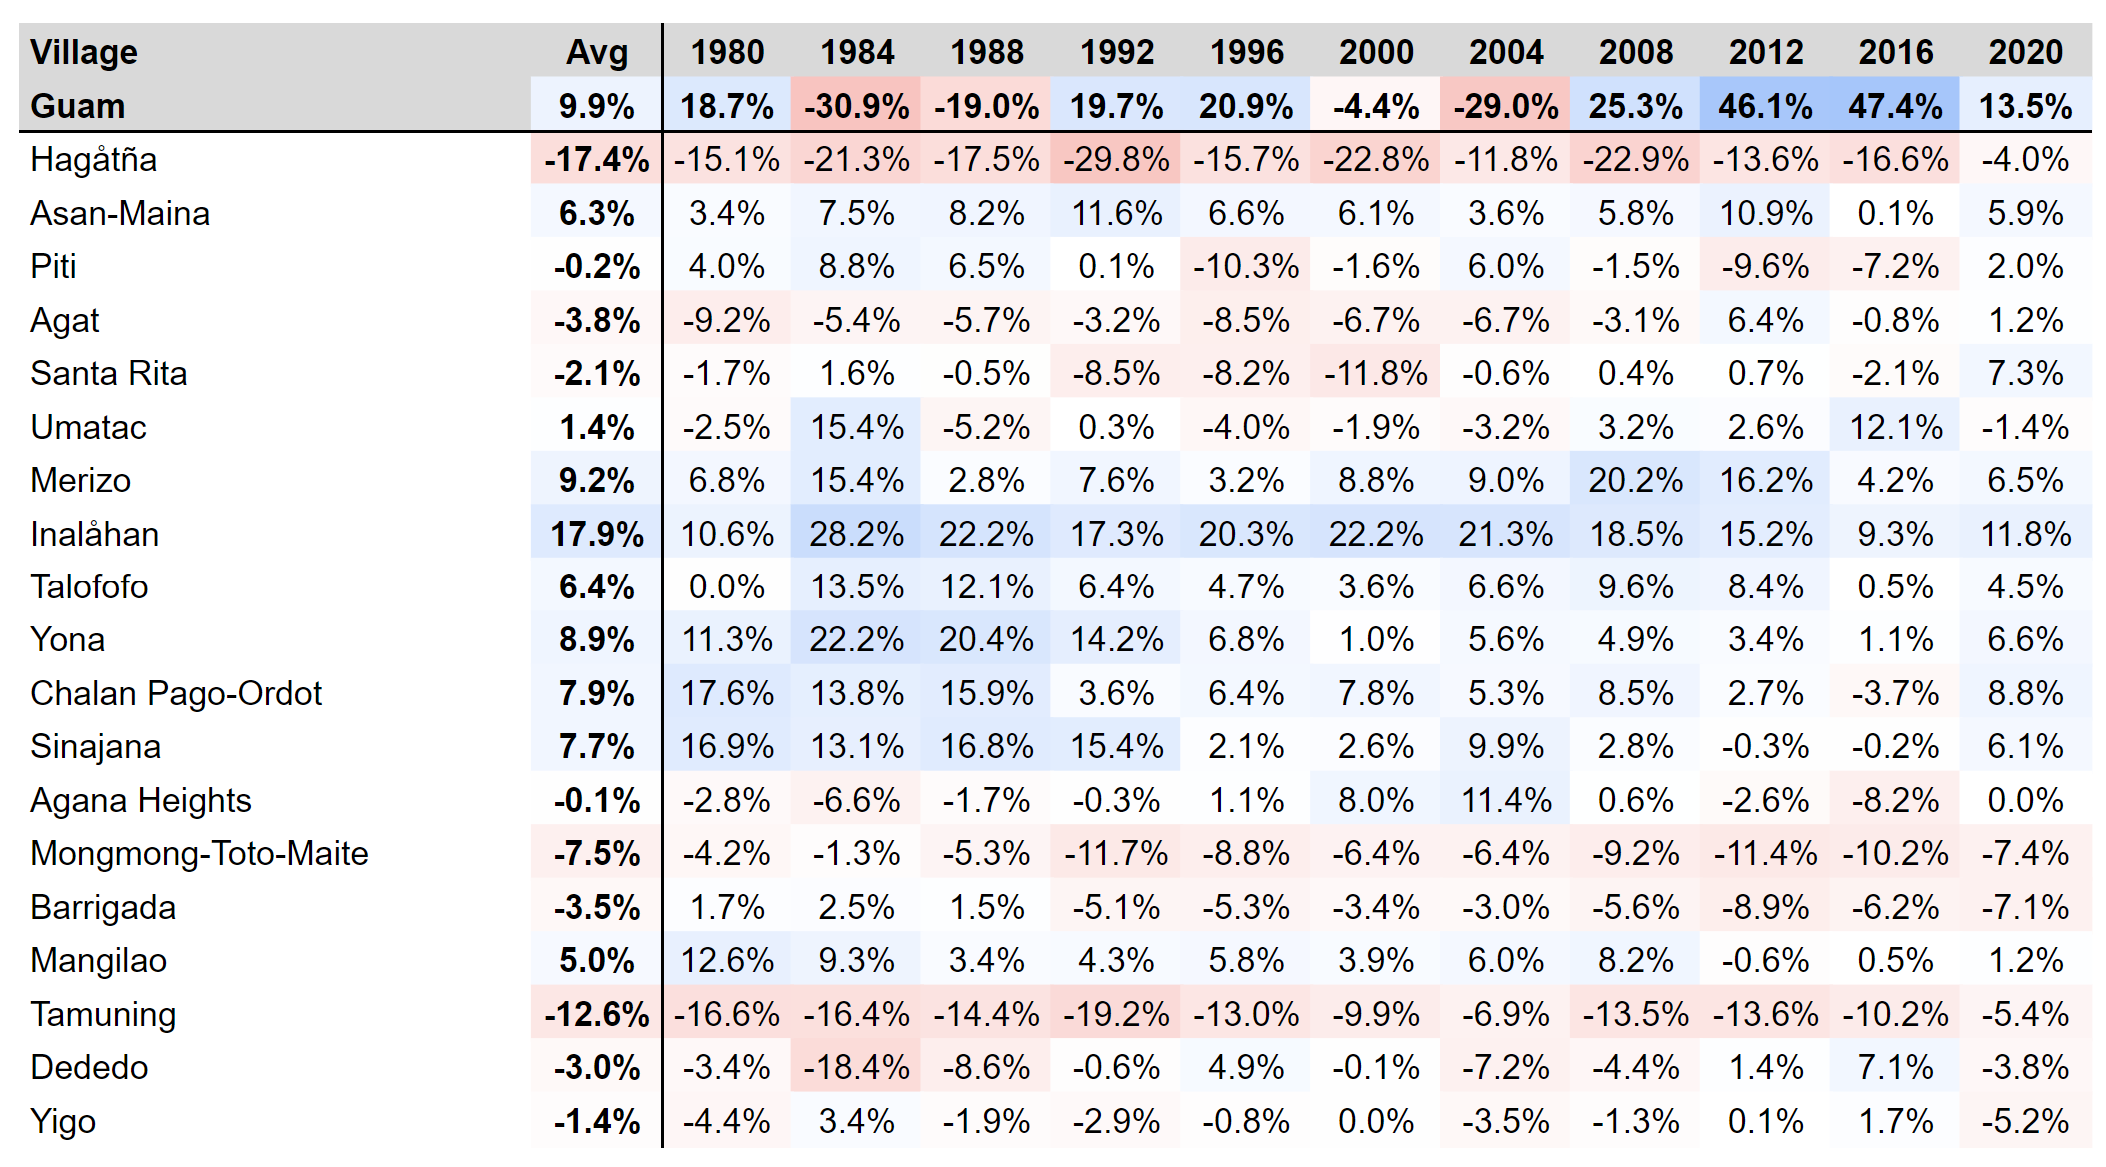
Margin, relative to the overall island-wide margin:
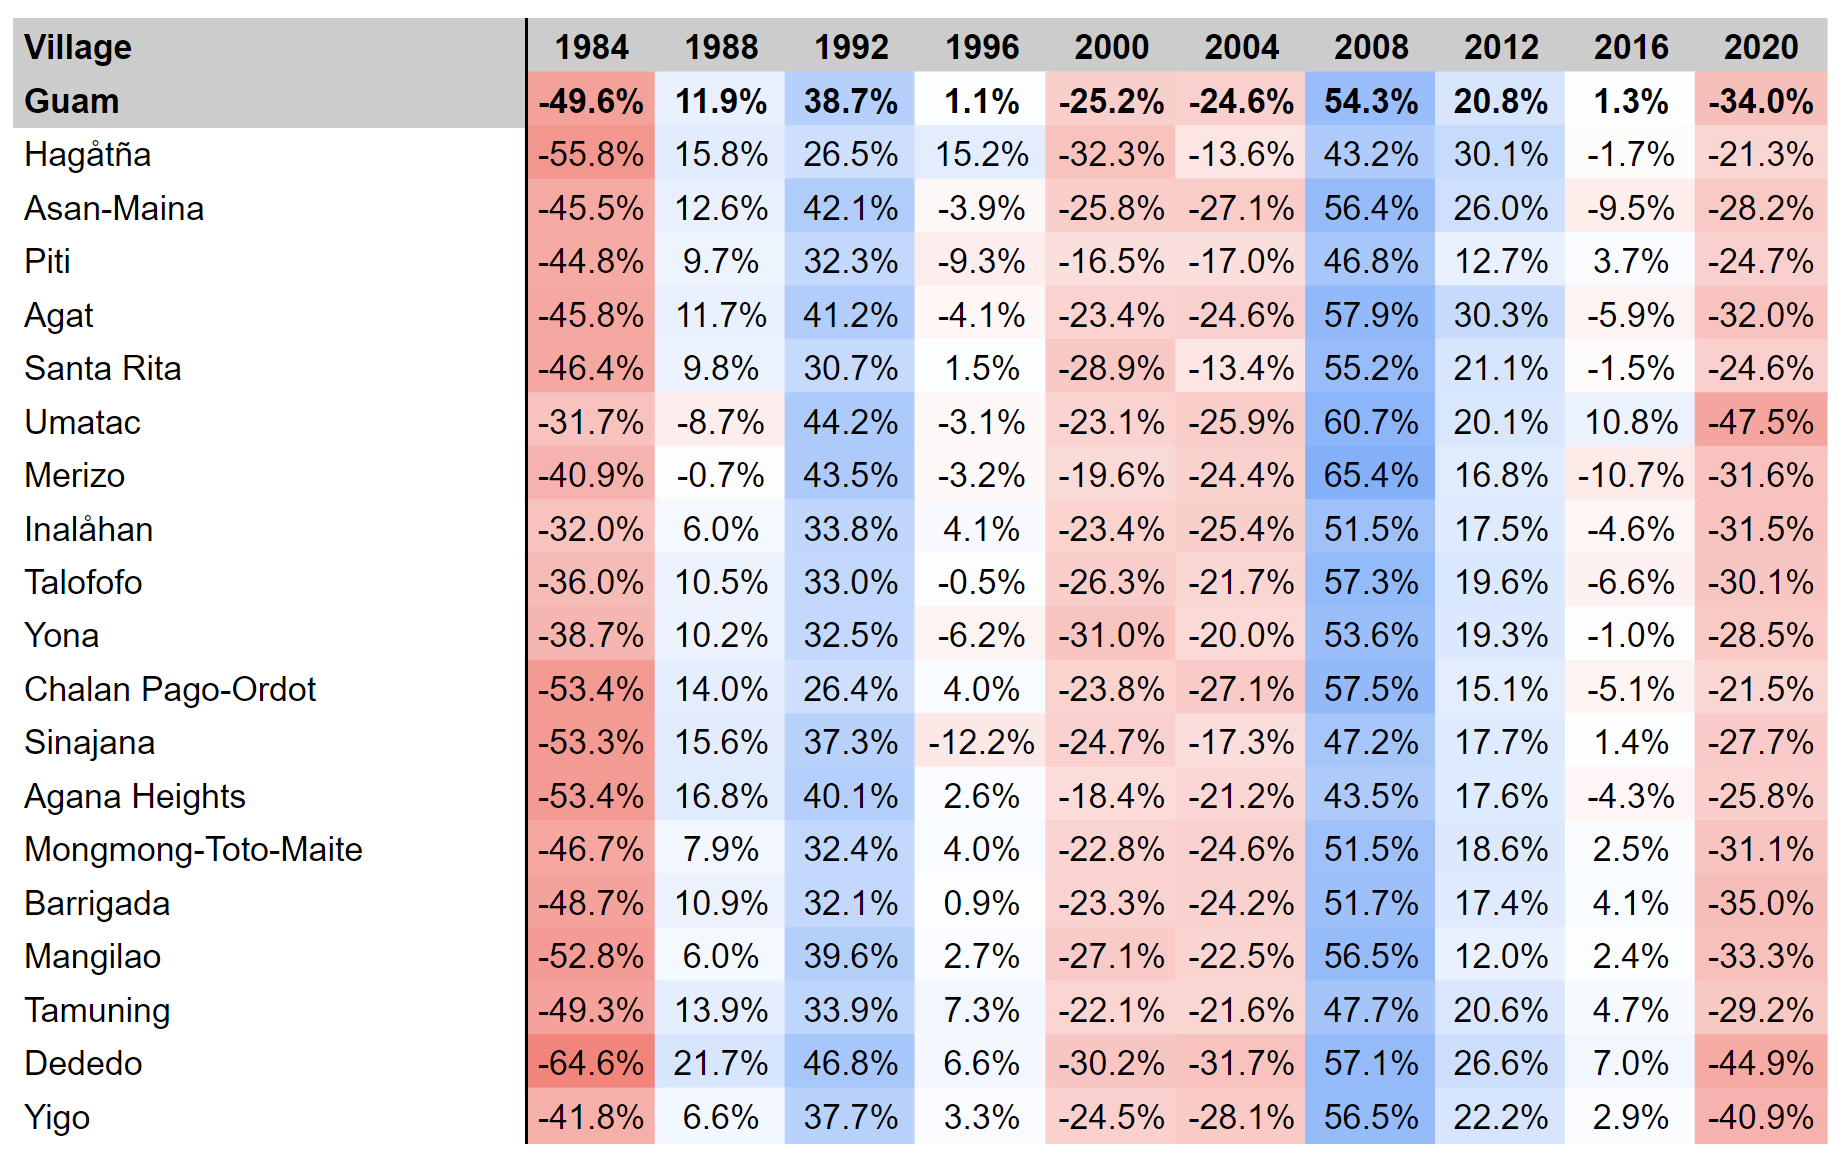
Swing:
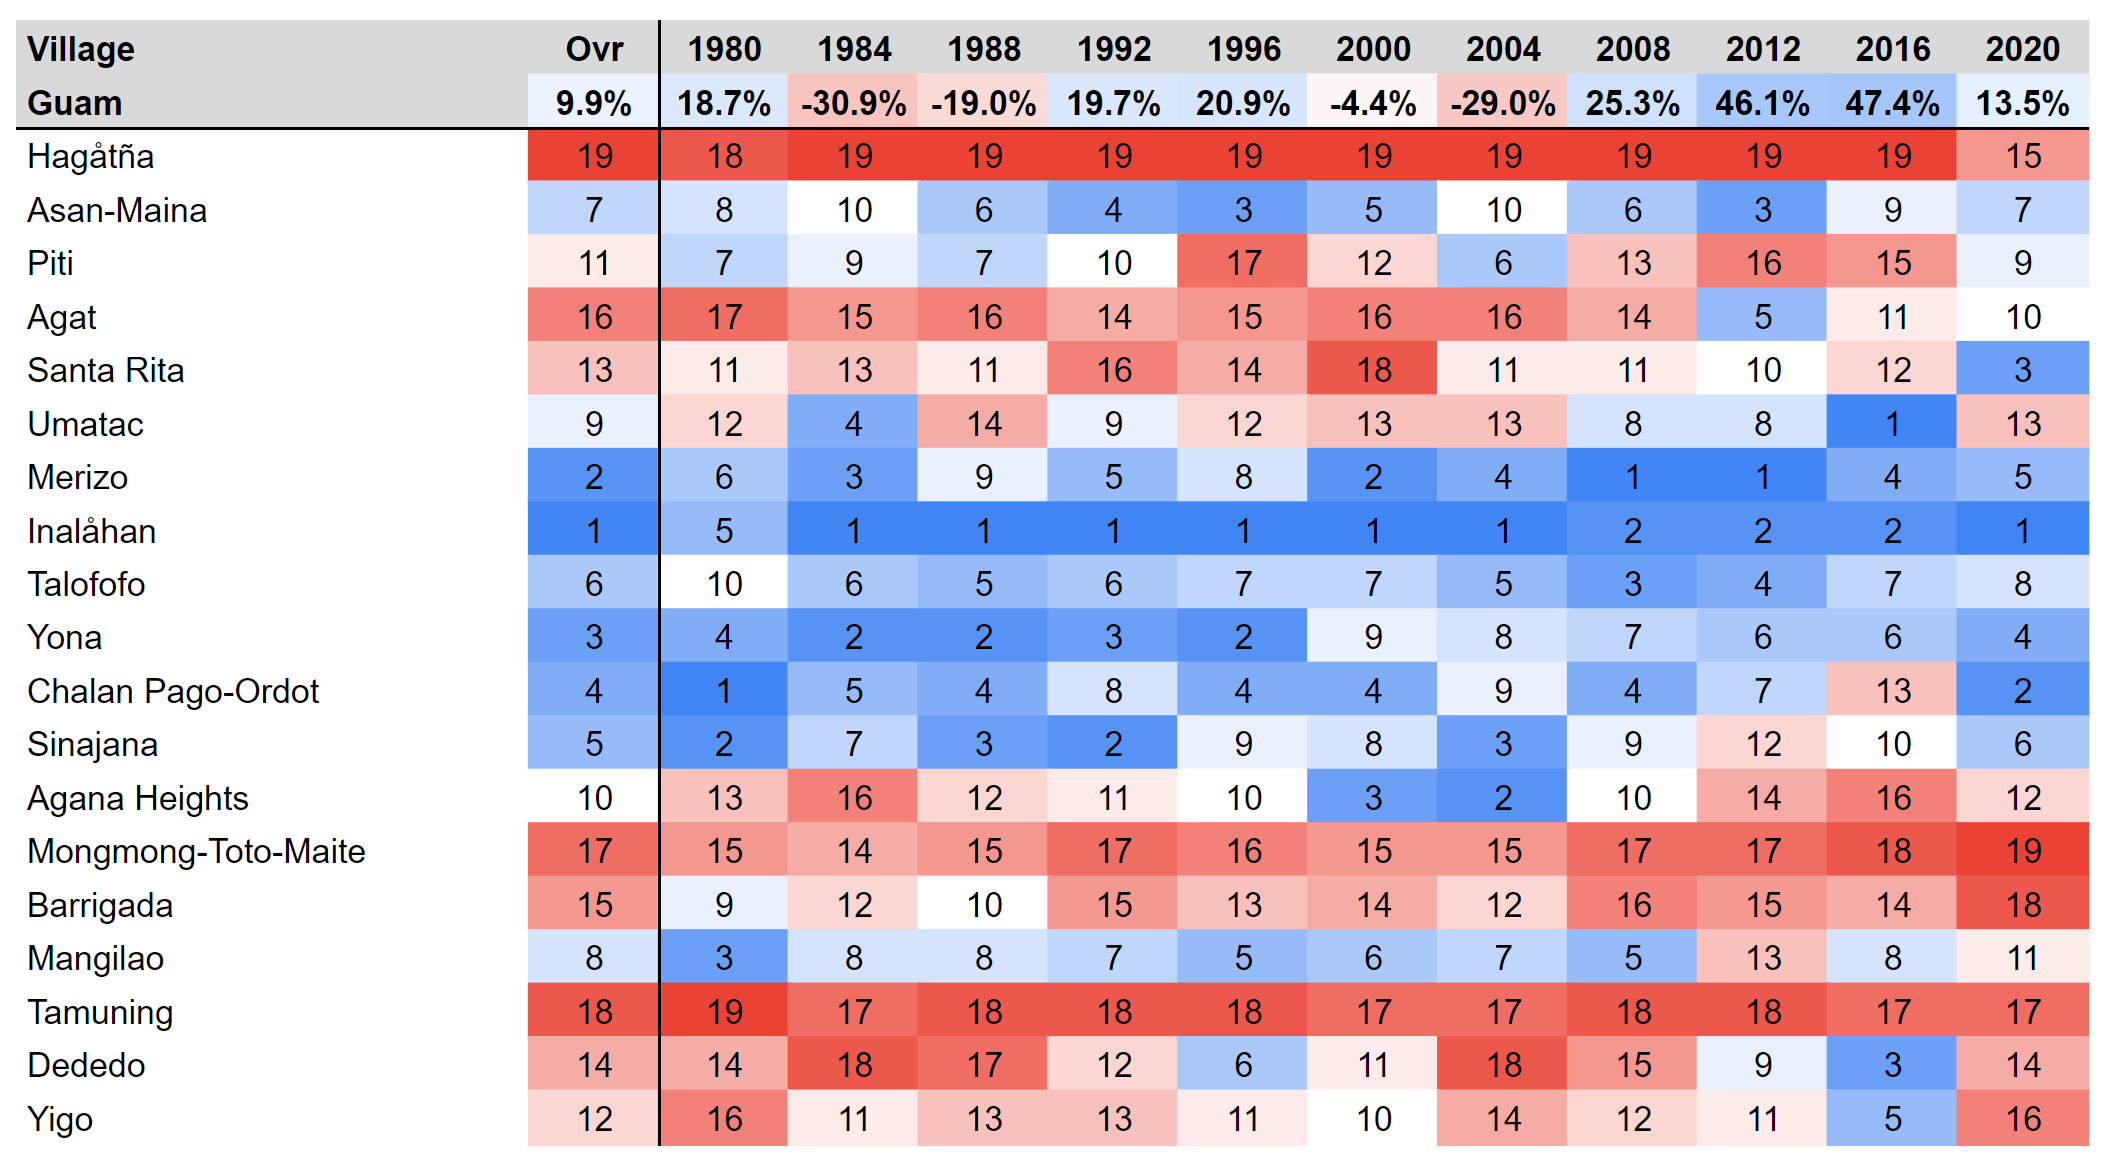
Rank, where 1 denotes the bluest village and 19 denotes the reddest:
With that, I hope you enjoyed this article. Please subscribe for more, and I’ll see you for the next one!