Some data on Canadian local elections
Toronto and Vancouver municipal results
This isn’t a particularly long or in-depth article, but I wanted to share some data I collected and aggregated on municipal elections in two of Canada’s largest cities, Toronto and Vancouver, that were held this month.
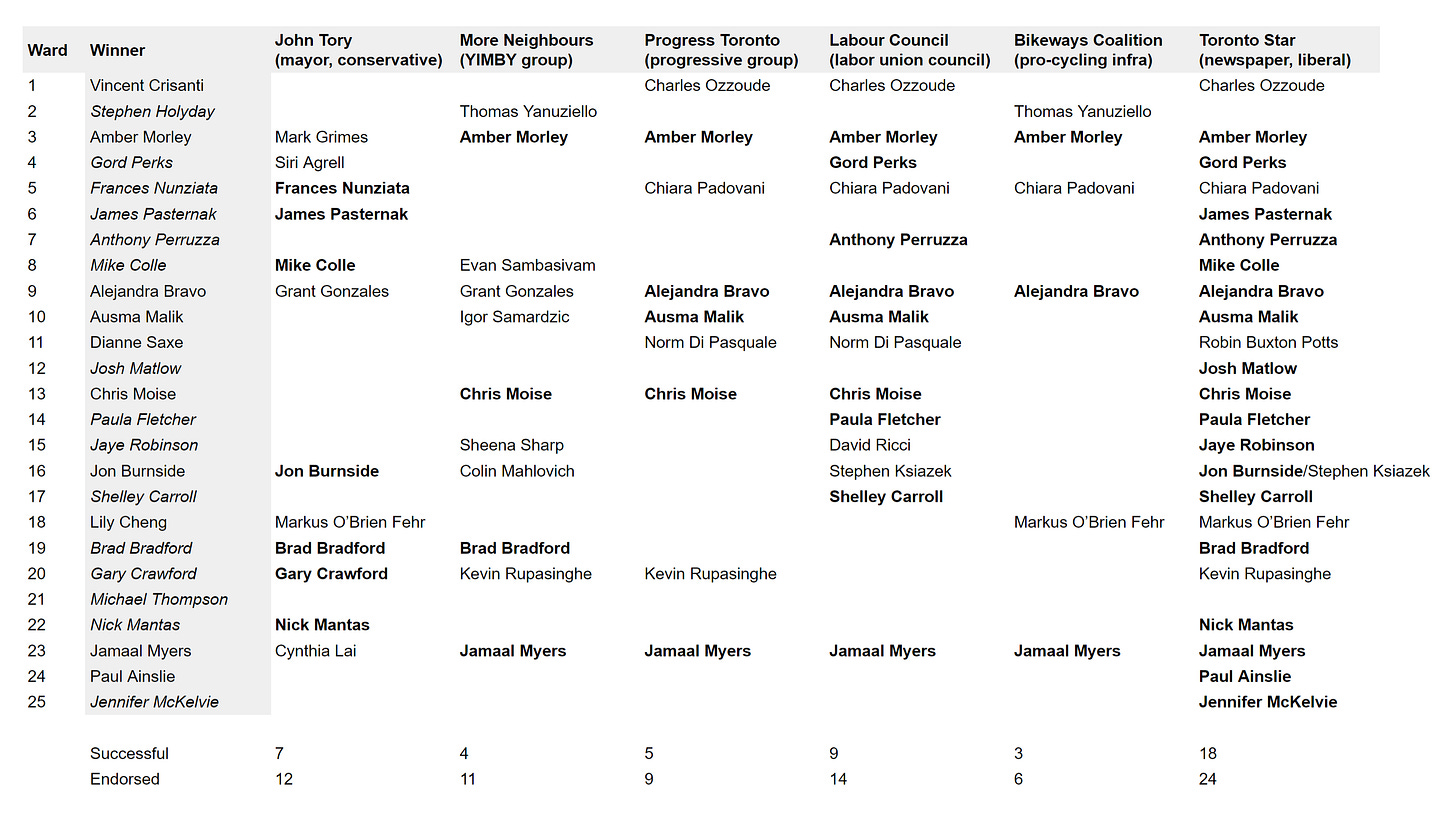
Toronto re-elected its mayor, John Tory, and elected 25 councillors, of which 15 are returning incumbents. I collected the endorsements from incumbent mayor John Tory, local political organizations, the local labor union council, and the Toronto Star in a spreadsheet, listing which candidates received endorsements and which were victorious. Italicized candidates are incumbents; bolded candidates in the endorsements section are winners.
Unsurprisingly, the Toronto Star, Canada’s largest daily newspaper by circulation, had the highest success rate, followed by the Toronto & York Region Labour Council. Mainstream newspapers tend to make more pragmatic endorsements, while political organizations, for example, focus more on principle and policy.
Tory and progressive group Progress Toronto both saw a majority of their endorsees win. Two of Progress Toronto’s four losing candidates lost by less than one percentage point. Interestingly neither Progress Toronto nor the Toronto Community Bikeways Coalition endorsed a single incumbent, and More Neighbours Toronto only endorsed one incumbent.
Overall, 15 incumbents were re-elected, 9 wards elected new candidates in open seats, and one, Ward 3, defeated its incumbent councillor.
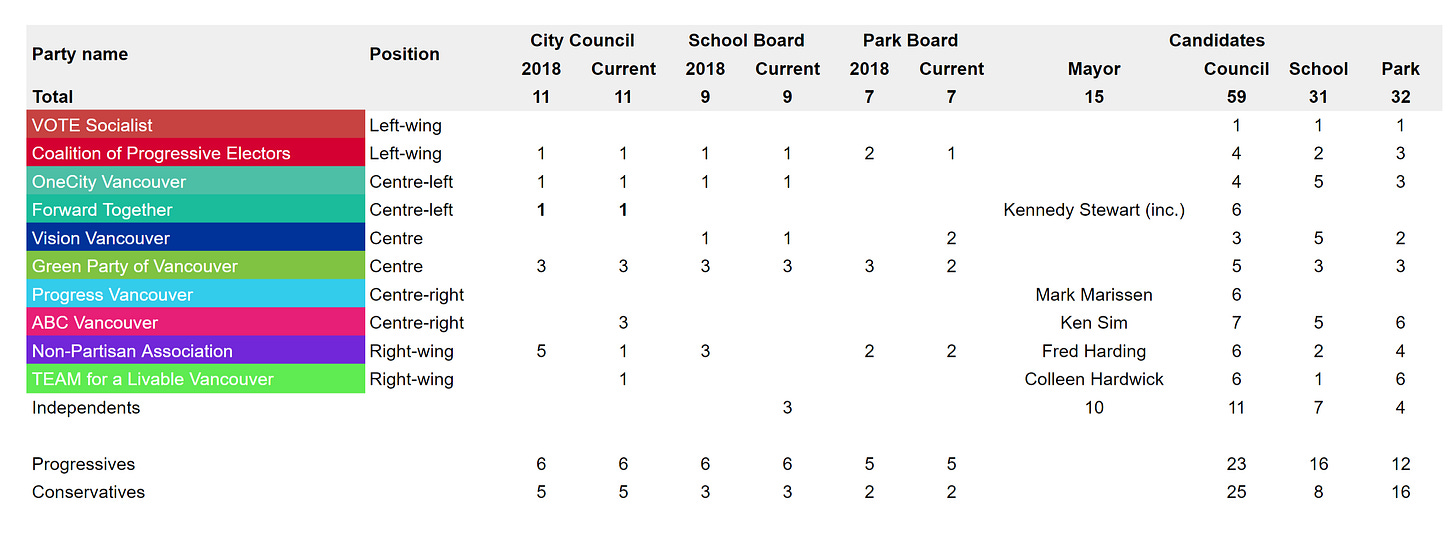
Vancouver elected a new mayor, Ken Sim, as well as councillors, a school board, and a park board. Unlike in Toronto, most candidates in Vancouver represented local political parties. I summarized these parties, the number of candidates they fielded, and their respective election performances.
First, candidate information:
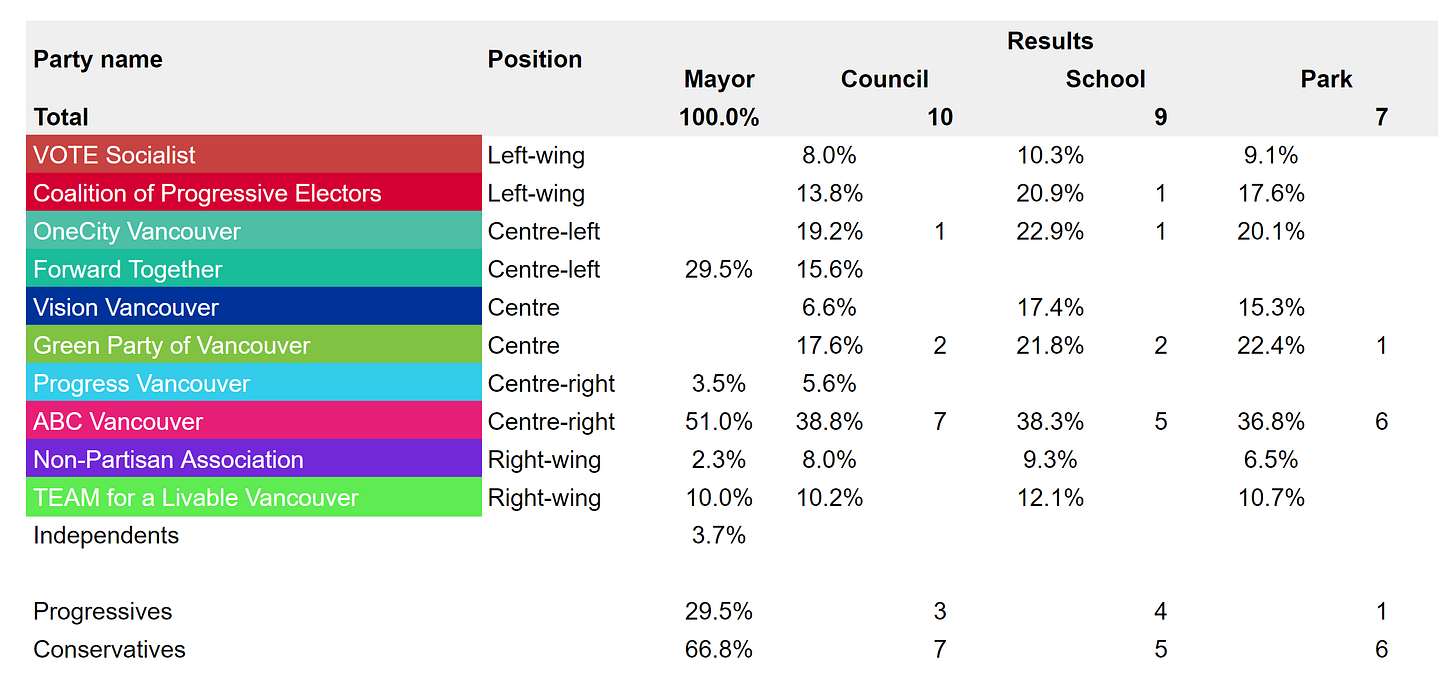
Below are two ways of measuring electoral performance. Vancouver’s council, school board, and park board members are elected by citywide block voting, with voters getting 10 votes to cast for council, 9 for school board, and 7 for park board, which can make calculating performance complicated.
A party’s performance can be measured either by the percent of total votes cast its candidates received in sum (which favors parties that ran more candidates) or by the average percent of voters who cast a ballot for the party’s candidates.
For example, if there are 100 thousand voters, each of which cast 10 votes (for a million total votes), and a particular candidate gets 30 thousand votes, they’ve received 3% of the total vote but appeared on 30% of ballots. If a party runs 5 candidates and each receives 20 thousand votes, the party has received 10% of the total vote but have appeared on only 20% of ballots.
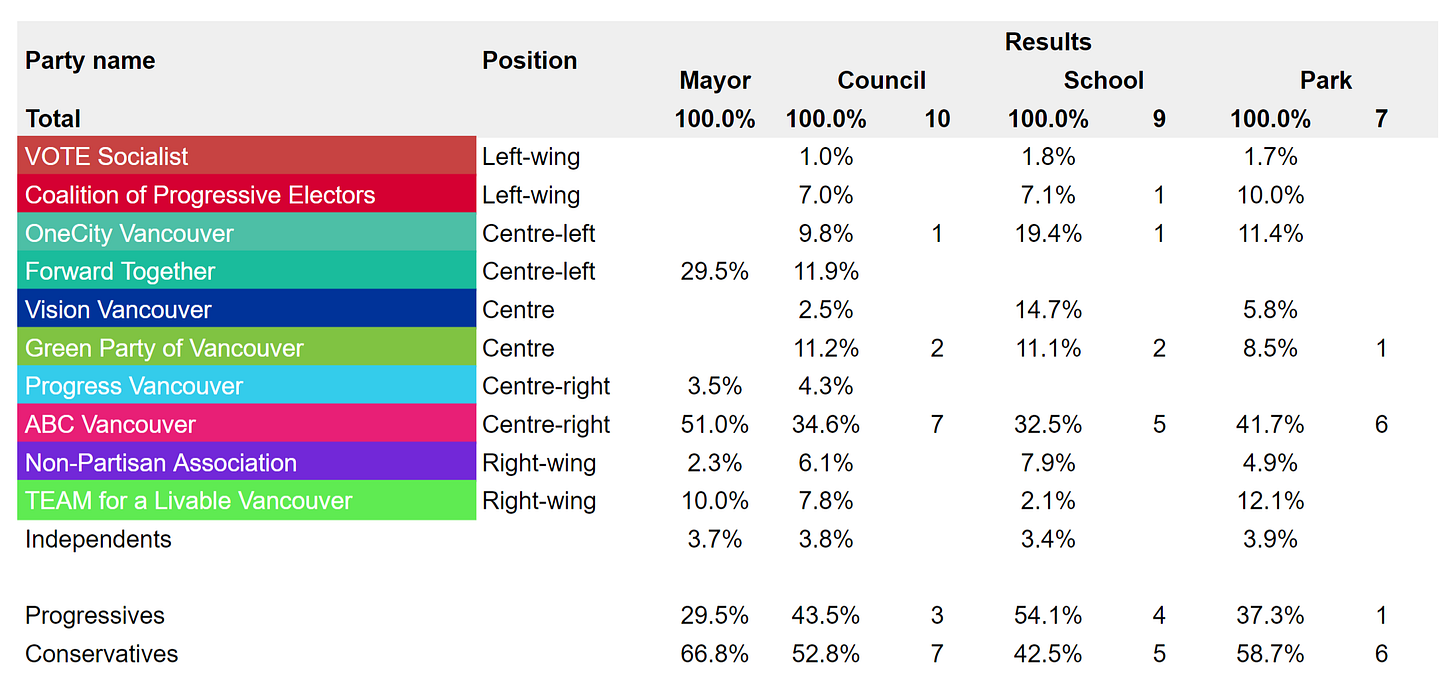
Electoral performance by percent of total votes:
As you can see above, conservative candidates were typically overrepresented, winning 70% of council seats with only a slim majority of the vote, and winning a majority of school board seats with a minority of the vote. This is due to greater vote efficiency thanks to less vote splitting, which is rewarded by the block voting system (essentially a multi-seat version of first past the post). Specifically, most of the conservative vote was concentrated among ABC candidates, while progressive votes were more evenly split between a number of parties.
Electoral performance by average percent of ballots cast:
That’s all for this article. Thanks for reading!


